. 2011 Jul 29;286(30):26768-80.
doi: 10.1074/jbc.M110.203646. Epub 2011 Jun 3.

Type XVII collagen regulates lamellipod stability, cell motility, and signaling to Rac1 by targeting bullous pemphigoid antigen 1e to alpha6beta4 integrin

Affiliations

Type XVII collagen regulates lamellipod stability, cell motility, and signaling to Rac1 by targeting bullous pemphigoid antigen 1e to alpha6beta4 integrin

Kevin J Hamill et al. J Biol Chem. .

Abstract

Rac1 activity, polarity, lamellipodial dynamics, and directed motility are defective in keratinocytes exhibiting deficiency in β4 integrin or knockdown of the plakin protein Bullous Pemphigoid Antigen 1e (BPAG1e). The activity of Rac, formation of stable lamellipodia, and directed migration are restored in β4 integrin-deficient cells by inducing expression of a truncated form of β4 integrin, which lacks binding sites for BPAG1e and plectin. In these same cells, BPAG1e, the truncated β4 integrin, and type XVII collagen (Col XVII), a transmembrane BPAG1e-binding protein, but not plectin, colocalize along the substratum-attached surface. This finding suggested to us that Col XVII mediates the association of BPAG1e and α6β4 integrin containing the truncated β4 subunit and supports directed migration. To test these possibilities, we knocked down Col XVII expression in keratinocytes expressing both full-length and truncated β4 integrin proteins. Col XVII-knockdown keratinocytes exhibit a loss in BPAG1e-α6β4 integrin interaction, a reduction in lamellipodial stability, an impairment in directional motility, and a decrease in Rac1 activity. These defects are rescued by a mutant Col XVII protein truncated at its carboxyl terminus. In summary, our results suggest that in motile cells Col XVII recruits BPAG1e to α6β4 integrin and is necessary for activation of signaling pathways, motile behavior, and lamellipodial stability.


Figures

FIGURE 1.
FIGURE 1.
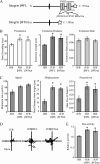
Keratinocytes deficient in β4 integrin or exhibiting BPAG1e knockdown show reduced lamellipodial persistence and extension length. A, representative kymographs of JEB cells and JEB cells induced to express full-length β4 integrin (JEBFLβ4). Phase-contrast images of individual keratinocytes were acquired every 5 s over 15 min. Kymographs were generated as a montage of the images beneath a single pixel-wide line drawn in the direction of migration with time on the vertical axes. The inset displays the measurements taken for each protrusion event. In B, persistence, extension distance, and extension rate measurements of the lamellipodia of JEB, JEBFLβ4, and JEB cells infected with CA Rac1 are presented. C, representative kymographs of HEK and a BPAG1e-knockdown line (Cn2BPAG1ekd, exhibiting a 75% knockdown in BPAG1e expression). In D, persistence, extension distance, and extension rate measurements of the lamellipodia of HEKs, Cn2BPAG1ekd, and Cn2BPAG1ekd cells infected with CA Rac1 are presented graphically. Values in B and D are plotted as mean ± S.E. from >20 cells per treatment, >3 protrusion events per cell. *, significance of p < 0.01.
FIGURE 2.
FIGURE 2.
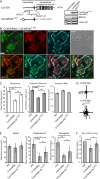
A truncated β4 integrin rescues JEB lamellipodial dynamics. A, schematic depiction of full-length β4 integrin (β4FL) and a truncated protein (β4Trun), with a star denoting a carboxyl-terminal GFP tag in each. Binding sites for plectin, Col XVII, and BPAG1e are indicated. In B, lamellipodial persistence, extension distance, and extension rate values for the lamellipodia of JEB cells, JEB cells expressing either full-length β4 integrin (JEBβ4FL), or JEB cells expressing the carboxyl-terminally truncated β4 integrin (JEBβ4Trun) are shown graphically. Values are plotted as mean ± S.E. from >20 cells per treatment, >3 protrusion events per cell. In C, JEB, JEBβ4FL, or JEBβ4Trun cells were imaged every 2 min over 2 h, migration paths were tracked, and mean total migration/time (speed), maximum displacement from the origin, and processivity (net displacement/total displacement) were plotted from >20 cells per assay, at least three assays per line. In D representative vector diagrams of JEB, JEBβ4FL, or JEBβ4Trun cells are presented with each line representing the migration path of a single cell. In E, protein extracts of subconfluent JEB, JEBβ4FL, and JEBβ4Trun cells were normalized for total protein levels and relative Rac activity levels determined by G-LISA. The asterisk in B, C, and E denotes significance, p < 0.01, relative to JEBs.
FIGURE 3.
FIGURE 3.
Truncated β4 integrin colocalizes and coprecipitates with Col XVII. JEBβ4FL (A and C) and JEBβ4Trun cells (B and D) were plated onto glass coverslips and, 48 h later, were fixed and imaged by confocal immunofluorescence microscopy following staining with antibodies against GFP (pseudocolored green) to visualize tagged β4 integrin protein, BPAG1e (pseudocolored red) and either Col XVII (A and B) or plectin (C and D) (pseudocolored cyan), as indicated. Overlays of green/red, green/cyan, and cyan/red images are shown in panels 5, 6, and 7 along with quantification of pixel colocalization (± S.D.) from >50 cells per overlay. Overlay of the three colors is shown in panel 8. Bars, 20 μm. In E, GFP and GFP-tagged proteins were immunoprecipitated from keratinocytes infected with GFP, JEBβ4FL, and JEBβ4Trun keratinocytes as indicated. Input lysates (In) and immunoprecipitates derived using anti-GFP- or IgG-conjugated beads (IP GFP and IP IgG, respectively) were immunoblotted (IB) with antibodies against Col XVII and GFP as indicated. Molecular mass standards are shown at right of blots. The red asterisks indicate a previously reported degradation product of the β4FL construct. We speculate that the lower molecular weight species in the Col XVII antibody blot (small arrows) represent Col XVII proteolytic products.
FIGURE 4.
FIGURE 4.
Col XVII knockdown leads to mislocalization of BPAG1e. HEKs were infected with a lentivirus encoding shRNA targeting Col XVII and clonal lines established through antibiotic resistance selection. In A, lysates from control HEKs and three stable clones (Cn1CXVIIkd, Cn2CXVIIkd, and Cn3CXVIIkd) were prepared for immunoblotting and probed with antibodies against Col XVII, BPAG1e, β4 integrin, and lamin A/C as indicated. The expression of Col XVII and BPAG1e relative to that in HEKs was calculated following densitometric scanning of the blots and is indicated underneath each lane. In B, cell surface expression of β4 integrin and α3 integrin was compared between HEKs and Col XVII shRNA clones by FACS as indicated (black tracing; secondary antibody alone). In C, HEKs, Cn3CXVIIkd (Col XVII-knockdown cells), and Cn2BPAG1ekd (BPAG1e-knockdown cells) were plated onto glass coverslips and, 48 h later, were fixed and then imaged by confocal immunofluorescence microscopy following staining with antibodies against β4 integrin (pseudocolored in green), BPAG1e (pseudocolored in red), and Col XVII (pseudocolored in cyan), as indicated. Green and red images are shown overlaid in the fourth column with colocalization appearing yellow. Red and cyan images are shown overlaid in the fifth column with colocalization appearing white. Phase-contrast images of the fixed and stained cells are shown in the column at the right. Bar, 20 μm.
FIGURE 5.
FIGURE 5.
Col XVII-knockdown keratinocytes show reduced lamellipodia persistence and extension length. In A, persistence, extension distance, and extension rate measurements of the lamellipodia of HEKs, scrambled shRNA-infected HEKs (HEK scram shRNA), three Col XVII-knockdown cell lines (Cn1CXVIIkd, Cn2CXVIIkd, and Cn3CXVIIkd), and Cn3CXVIIkd cells infected with CA Rac1, CA RhoA, or CA cdc42 are depicted. Values are plotted as mean ± S.E. from >20 cells per treatment, >3 protrusion events per cell. B, representative kymographs of a HEK and a Cn3CXVIIkd (Col XVII-knockdown) cell. In C and D, cells were imaged every 2 min over 2 h, and the migration paths of single cells were tracked. In C, representative vector diagrams of HEKs, scrambled shRNA-infected HEKs, and Col XVII-knockdown clones are presented. In D, total distance migrated/time (speed), maximum net displacement, and net displacement/total displacement (processivity) are presented from >20 cells per assay, at least 3 assays per cell line. In C, protein lysates from subconfluent HEKs, scrambled shRNA-infected HEKs, and Col XVII-knockdown cells were normalized to total protein levels, and relative Rac activity was determined by G-LISA. The graph represents relative mean ± S.D. from three independent assays. The asterisks in A, D, and E denote significance, p < 0.01, relative to HEKs.
FIGURE 6.
FIGURE 6.
Expression of a Col XVII fragment rescues the motility defects of Col XVII-knockdown keratinocytes. Diagrammatic representations of Col XVII and the Col XVII fragment (Col XVII Nt1–517), comprising the Col XVII cytoplasmic, transmembrane, and juxtamembrane domains, used in these studies are shown in A. Binding sites for α6 integrin, β4 integrin, and BPAG1e are marked. Cn2CXVIIkd cells were adenovirally infected to induce expression of the GFP-tagged Col XVII Nt1–517. Total protein lysates from uninfected and Col XVII Nt1–517-infected Cn3CXVIIkd cells were immunoblotted with antibodies against GFP, BPAG1e, and lamin A/C. In B, 2 days following infection, cells were plated overnight onto glass coverslips, fixed, and processed for indirect immunofluorescence microscopy for GFP (pseudocolored green), and with antibodies against BPAG1e (pseudocolored red), and β4 integrin (pseudocolored cyan). Red/green, green/cyan, and red/cyan images are shown overlaid in panels 4–6. Percentage colocalization of the GFP signal with BPAG1e or β4 integrin staining is indicated in panels 5 and 6. Percentage colocalization of BPAG1e staining with β4 integrin is indicated in panel 7. Values presented as mean ± S.D. from three experiments, >20 cells/experiment. Bar in B, 20 μm. In C, persistence, extension distance, and extension rate measurements of the lamellipodia of HEKs, Cn3CXVIIkd cells, and Cn3CXVIIkd cells expressing Col XVII Nt1–517 were determined by kymography. Values plotted in C are the mean ± S.E. from >15 cells per treatment, >3 protrusion events per cell. In D and E, the motility of the indicated cells was tracked over 2 h with images being taken every 2 min. In D, the migration paths of at least 10 individual cells are plotted relative to their start position (origin) in each vector diagram. In E, total distance migrated/time (speed), maximum net displacement, and net displacement/total migration (processivity) are plotted from >20 cells per assay at least three assays per cell line. In F, protein lysates of subconfluent HEKs, Cn3CXVIIkd cells, and Cn3CXVIIkd cells expressing Col XVII were normalized to total protein levels, and relative Rac activity determined by GLISA. The graph represents relative mean ± S.D. from three independent assays. The asterisks in C, E, and F denote significance; *, p < 0.05; **, p < 0.01.
FIGURE 7.
FIGURE 7.
Col XVII-knockdown keratinocytes display enhanced β4 integrin dynamics. In A, immunoblots of total protein extracts of JEBβ4FL and JEBβ4Trun as well as JEBβ4FL and JEBβ4Trun cells stably infected with shRNA targeting Col XVII probed with antibodies against Col XVII and Lamin A/C are shown. Expression of Col XVII relative to parental lines is shown beneath each lane. In B, persistence, extension distance, and extension rate measurements of the lamellipodia of JEB, JEBβ4FL, JEBβ4Trun along with JEBβ4FL and JEBβ4Trun exhibiting Col XVII knockdown are presented. Values are plotted as mean ± S.E. from >20 cells per treatment, >3 protrusion events per cell. In C, protein lysates from the indicated lines were normalized to total protein levels and relative Rac activity determined by G-LISA. The graph represents relative mean ± S.D. from three independent assays. Bracketed asterisks denote significant differences between columns; *, p < 0.05; **, p < 0.01. D and E depict rates of FRAP of GFP-tagged full-length β4 integrin (D) or truncated β4 integrin (E) in JEB cells (black lines) or JEB cells exhibiting Col XVII knockdown (gray lines). Lines represent mean ± S.E. of >10 cells per cell line. Vertical lines indicate time to 50% recovery; * denotes significance, p < 0.05.

Similar articles

Cited by

References

    1. Petrie R. J., Doyle A. D., Yamada K. M. (2009) Nat. Rev. Mol. Cell Biol. 10, 538–549 - PMC - PubMed
    1. Lauffenburger D. A., Horwitz A. F. (1996) Cell. 84, 359–369 - PubMed
    1. Hinz B., Alt W., Johnen C., Herzog V., Kaiser H. W. (1999) Exp. Cell Res. 251, 234–243 - PubMed
    1. Chodniewicz D., Klemke R. L. (2004) Exp. Cell Res. 301, 31–37 - PubMed
    1. Yang N., Higuchi O., Ohashi K., Nagata K., Wada A., Kangawa K., Nishida E., Mizuno K. (1998) Nature. 393, 809–812 - PubMed

Publication types

MeSH terms