

Concurrent detection of autolysosome formation and lysosomal degradation by flow cytometry in a high-content screen for inducers of autophagy
- PMID: 21635740
- PMCID: PMC3121655
- DOI: 10.1186/1741-7007-9-38
Concurrent detection of autolysosome formation and lysosomal degradation by flow cytometry in a high-content screen for inducers of autophagy
Abstract
Background: Autophagy mediates lysosomal degradation of cytosolic components. Recent work has associated autophagic dysfunction with pathologies, including cancer and cardiovascular disease. To date, the identification of clinically-applicable drugs that modulate autophagy has been hampered by the lack of standardized assays capable of precisely reporting autophagic activity.
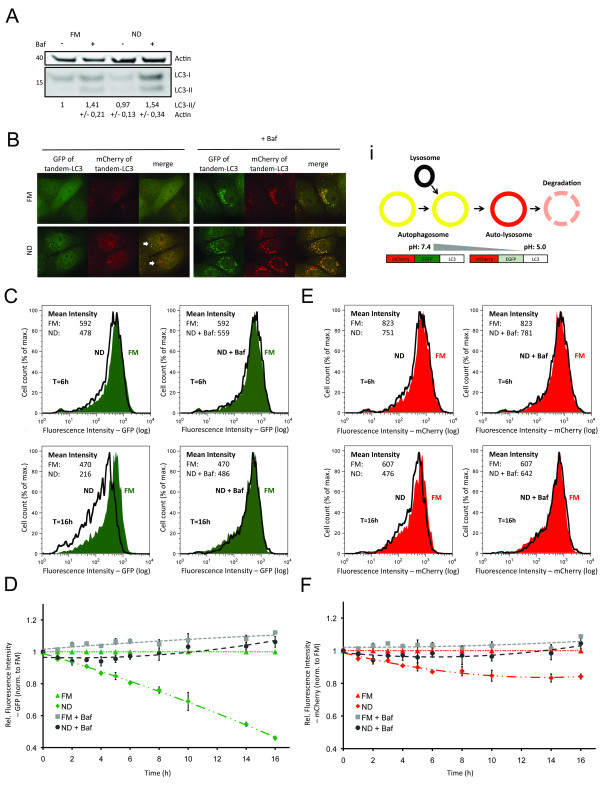
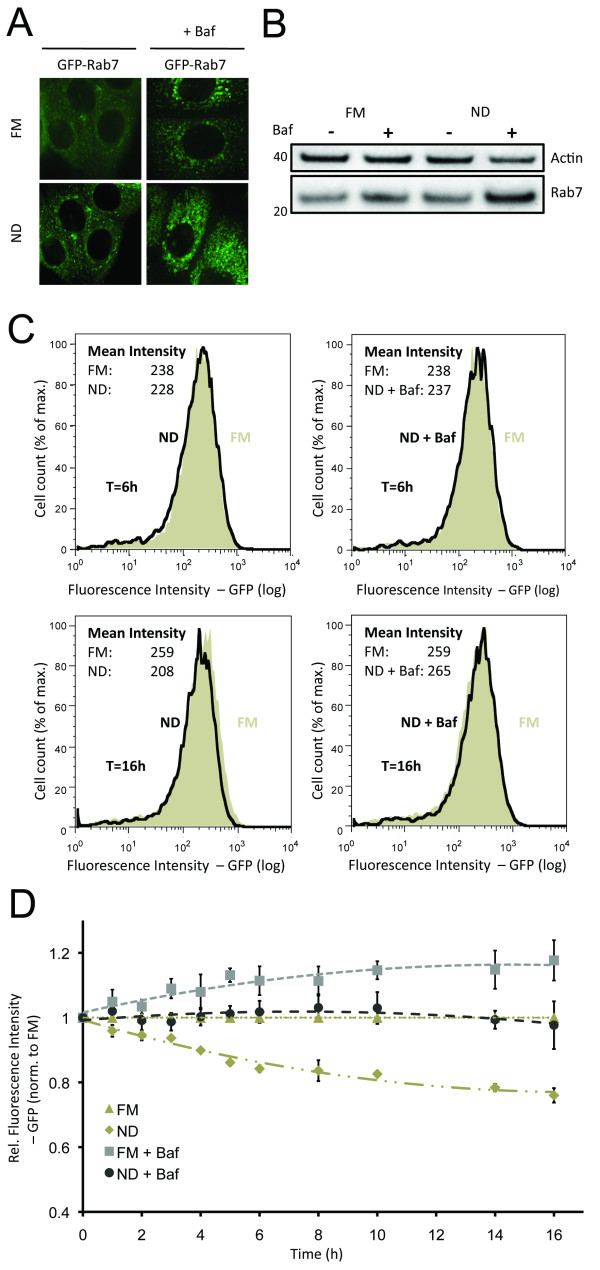
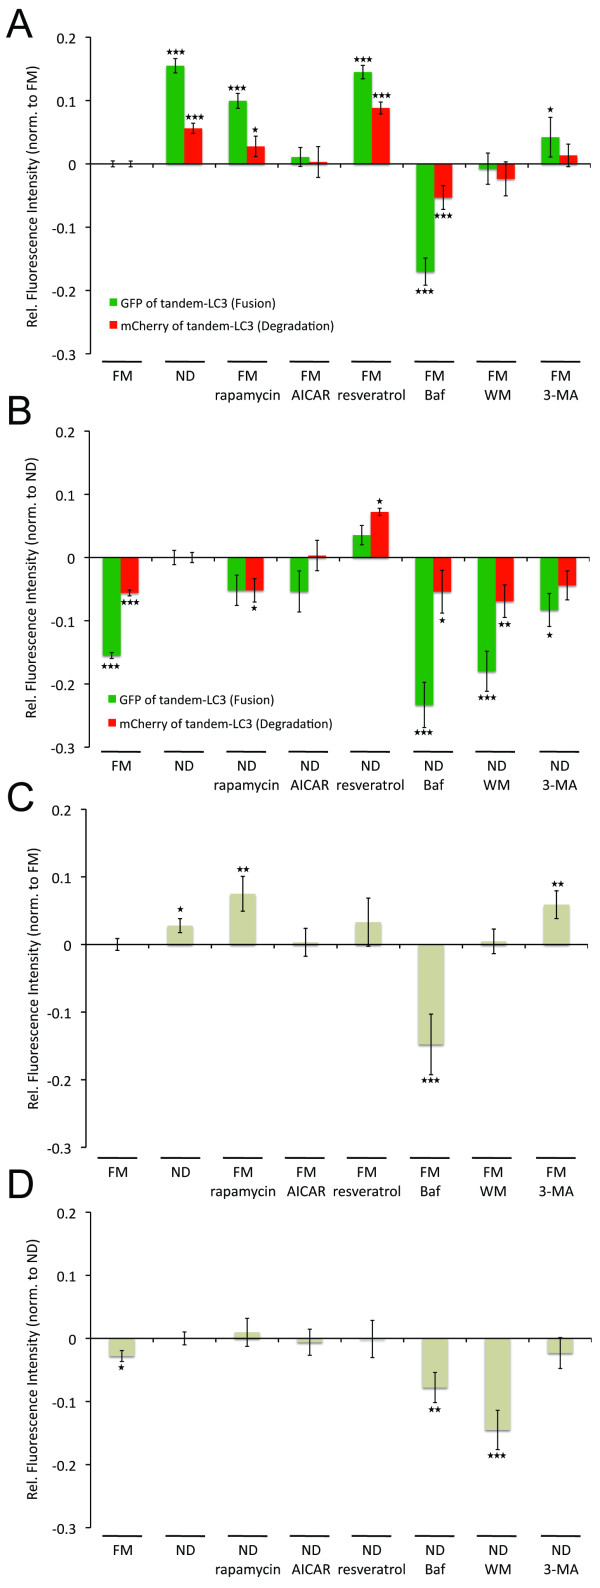
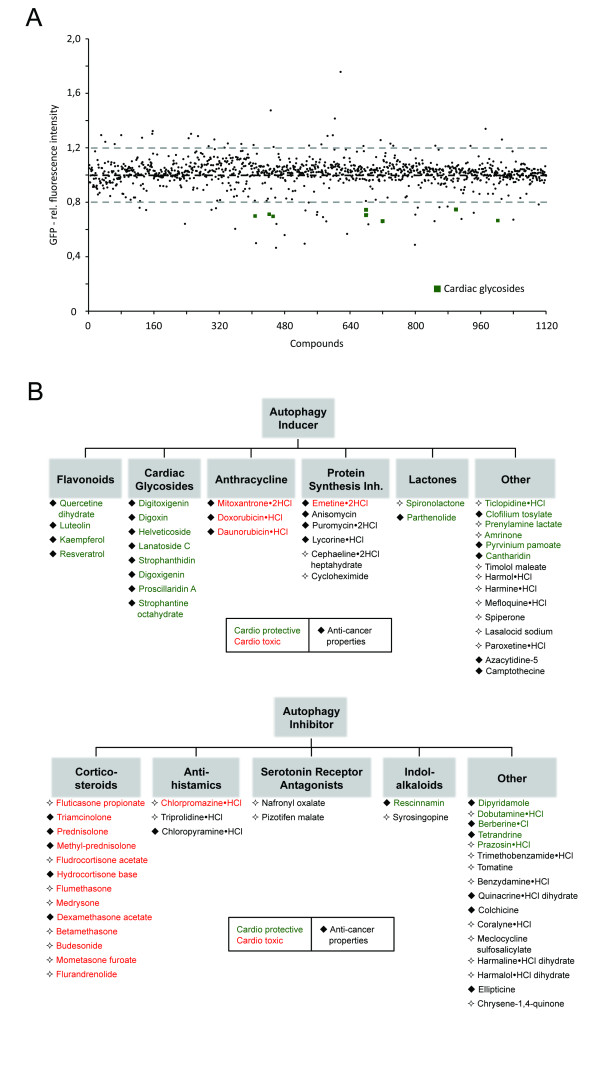
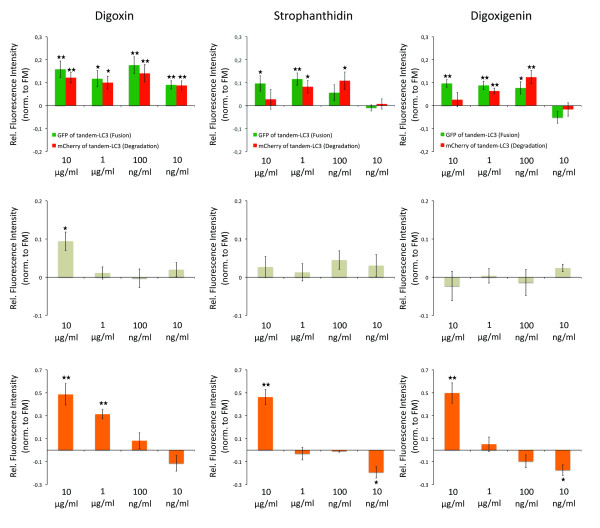
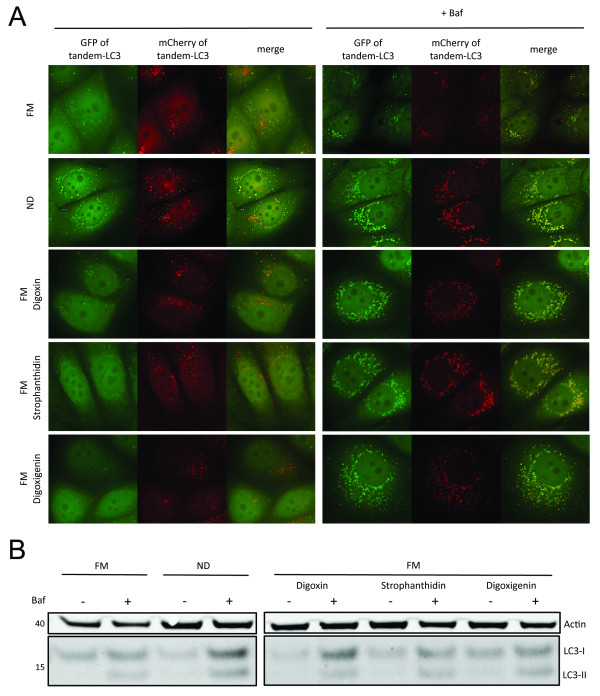
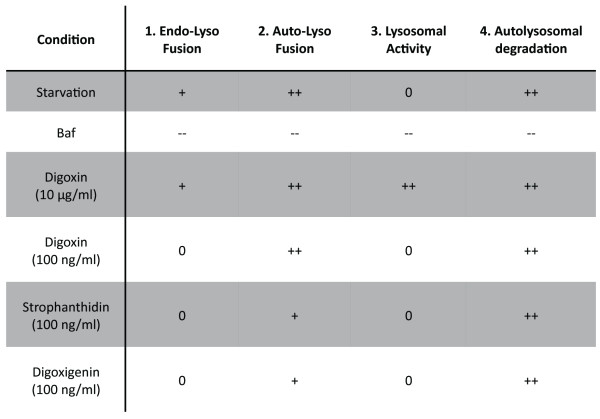
Results: We developed and implemented a high-content, flow-cytometry-based screening approach for rapid, precise, and quantitative measurements of pharmaceutical control over autophagy. Our assay allowed for time-resolved individual measurements of autolysosome formation and degradation, and endolysosomal activities under both basal and activated autophagy conditions. As proof of concept, we analyzed conventional autophagy regulators, including cardioprotective compounds aminoimidazole carboxamide ribonucleotide (AICAR), rapamycin, and resveratrol, and revealed striking conditional dependencies of rapamycin and autophagy inhibitor 3-methyladenine (3-MA). To identify novel autophagy modulators with translational potential, we screened the Prestwick Chemical Library of 1,120 US Food and Drug Administration (FDA)-approved compounds for impact on autolysosome formation. In all, 38 compounds were identified as potential activators, and 36 as potential inhibitors of autophagy. Notably, amongst the autophagy enhancers were cardiac glycosides, from which we selected digoxin, strophanthidin, and digoxigenin for validation by standard biochemical and imaging techniques. We report the induction of autophagic flux by these cardiac glycosides, and the concentrations allowing for specific enhancement of autophagic activities without impact on endolysosomal activities.
Conclusions: Our systematic analysis of autophagic and endolysosomal activities outperformed conventional autophagy assays and highlights the complexity of drug influence on autophagy. We demonstrate conditional dependencies of established regulators. Moreover, we identified new autophagy regulators and characterized cardiac glycosides as novel potent inducers of autophagic flux.
Figures
Comment in
-
Following autophagy step by step.BMC Biol. 2011 Jun 2;9:39. doi: 10.1186/1741-7007-9-39. BMC Biol. 2011. PMID: 21635796 Free PMC article.
Similar articles
-
Following autophagy step by step.BMC Biol. 2011 Jun 2;9:39. doi: 10.1186/1741-7007-9-39. BMC Biol. 2011. PMID: 21635796 Free PMC article.
-
AMDE-1 is a dual function chemical for autophagy activation and inhibition.PLoS One. 2015 Apr 20;10(3):e0122083. doi: 10.1371/journal.pone.0122083. eCollection 2015. PLoS One. 2015. PMID: 25894744 Free PMC article.
-
Dengue Virus Inhibition of Autophagic Flux and Dependency of Viral Replication on Proteasomal Degradation of the Autophagy Receptor p62.J Virol. 2015 Aug;89(15):8026-41. doi: 10.1128/JVI.00787-15. J Virol. 2015. PMID: 26018155 Free PMC article.
-
Quantifying autophagy: Measuring LC3 puncta and autolysosome formation in cells using multispectral imaging flow cytometry.Methods. 2017 Jan 1;112:147-156. doi: 10.1016/j.ymeth.2016.05.022. Epub 2016 Jun 1. Methods. 2017. PMID: 27263026 Review.
-
Targeting the Autophagy/Lysosomal Degradation Pathway in Parkinson's Disease.Curr Neuropharmacol. 2016;14(3):238-49. doi: 10.2174/1570159x13666151030103027. Curr Neuropharmacol. 2016. PMID: 26517050 Free PMC article. Review.
Cited by
-
Development of autophagy inducers in clinical medicine.J Clin Invest. 2015 Jan;125(1):14-24. doi: 10.1172/JCI73938. Epub 2015 Jan 2. J Clin Invest. 2015. PMID: 25654546 Free PMC article. Review.
-
AUTOCOUNTER, an ImageJ JavaScript to analyze LC3B-GFP expression dynamics in autophagy-induced astrocytoma cells.Eur J Histochem. 2012 Oct 11;56(4):e44. doi: 10.4081/ejh.2012.e44. Eur J Histochem. 2012. PMID: 23361240 Free PMC article.
-
Cardiac Glycoside Glucoevatromonoside Induces Cancer Type-Specific Cell Death.Front Pharmacol. 2018 Mar 1;9:70. doi: 10.3389/fphar.2018.00070. eCollection 2018. Front Pharmacol. 2018. PMID: 29545747 Free PMC article.
-
Autophagy variation within a cell population determines cell fate through selective degradation of Fap-1.Nat Cell Biol. 2014 Jan;16(1):47-54. doi: 10.1038/ncb2886. Epub 2013 Dec 8. Nat Cell Biol. 2014. PMID: 24316673 Free PMC article.
-
Folliculin regulates ampk-dependent autophagy and metabolic stress survival.PLoS Genet. 2014 Apr 24;10(4):e1004273. doi: 10.1371/journal.pgen.1004273. eCollection 2014 Apr. PLoS Genet. 2014. PMID: 24763318 Free PMC article.
References
-
- Komatsu M, Kurokawa H, Waguri S, Taguchi K, Kobayashi A, Ichimura Y, Sou Y-S, Ueno I, Sakamoto A, Tong KI, Kim M, Nishito Y, Iemura S-i, Natsume T, Ueno T, Kominami E, Motohashi H, Tanaka K, Yamamoto M. The selective autophagy substrate p62 activates the stress responsive transcription factor Nrf2 through inactivation of Keap1. Nat Cell Biol. 2010;12:213–223. - PubMed
Publication types
MeSH terms
Substances
LinkOut - more resources
Full Text Sources
Other Literature Sources
Research Materials
