The nucleosome map of the mammalian liver
- PMID: 21623366
- PMCID: PMC3148658
- DOI: 10.1038/nsmb.2060
The nucleosome map of the mammalian liver
Abstract
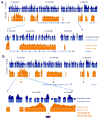
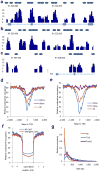
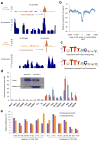
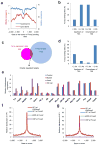
Binding to nucleosomal DNA is critical for 'pioneer' transcription factors such as the winged-helix transcription factors Foxa1 and Foxa2 to regulate chromatin structure and gene activation. Here we report the genome-wide map of nucleosome positions in the mouse liver, with emphasis on transcriptional start sites, CpG islands, Foxa2 binding sites and their correlation with gene expression. Despite the heterogeneity of liver tissue, we could clearly discern the nucleosome pattern of the predominant liver cell, the hepatocyte. By analyzing nucleosome occupancy and the distributions of heterochromatin protein 1 (Hp1), CBP (also known as Crebbp) and p300 (Ep300) in Foxa1- and Foxa2-deficient livers, we find that the maintenance of nucleosome position and chromatin structure surrounding Foxa2 binding sites is independent of Foxa1 and Foxa2.
Conflict of interest statement
The authors declare no competing financial interests.
Figures


Similar articles
-
Affinity, stoichiometry and cooperativity of heterochromatin protein 1 (HP1) binding to nucleosomal arrays.J Phys Condens Matter. 2015 Feb 18;27(6):064110. doi: 10.1088/0953-8984/27/6/064110. Epub 2015 Jan 7. J Phys Condens Matter. 2015. PMID: 25563825
-
Genome-wide nucleosome mapping of Plasmodium falciparum reveals histone-rich coding and histone-poor intergenic regions and chromatin remodeling of core and subtelomeric genes.BMC Genomics. 2009 Dec 16;10:610. doi: 10.1186/1471-2164-10-610. BMC Genomics. 2009. PMID: 20015349 Free PMC article.
-
Transcriptional networks in the liver: hepatocyte nuclear factor 6 function is largely independent of Foxa2.Mol Cell Biol. 2005 Aug;25(16):7069-77. doi: 10.1128/MCB.25.16.7069-7077.2005. Mol Cell Biol. 2005. PMID: 16055718 Free PMC article.
-
Nucleosome distribution and linker DNA: connecting nuclear function to dynamic chromatin structure.Biochem Cell Biol. 2011 Feb;89(1):24-34. doi: 10.1139/O10-139. Biochem Cell Biol. 2011. PMID: 21326360 Free PMC article. Review.
-
Beyond the Nucleosome: Nucleosome-Protein Interactions and Higher Order Chromatin Structure.J Mol Biol. 2021 Mar 19;433(6):166827. doi: 10.1016/j.jmb.2021.166827. Epub 2021 Jan 16. J Mol Biol. 2021. PMID: 33460684 Review.
Cited by
-
NUCLIZE for quantifying epigenome: generating histone modification data at single-nucleosome resolution using genuine nucleosome positions.BMC Genomics. 2019 Jul 2;20(1):541. doi: 10.1186/s12864-019-5932-6. BMC Genomics. 2019. PMID: 31266464 Free PMC article.
-
Genetic determinants and epigenetic effects of pioneer-factor occupancy.Nat Genet. 2018 Feb;50(2):250-258. doi: 10.1038/s41588-017-0034-3. Epub 2018 Jan 22. Nat Genet. 2018. PMID: 29358654 Free PMC article.
-
Major Determinants of Nucleosome Positioning.Biophys J. 2018 May 22;114(10):2279-2289. doi: 10.1016/j.bpj.2018.03.015. Epub 2018 Apr 6. Biophys J. 2018. PMID: 29628211 Free PMC article. Review.
-
Improving genome-wide mapping of nucleosomes in Trypanosome cruzi.PLoS One. 2023 Nov 21;18(11):e0293809. doi: 10.1371/journal.pone.0293809. eCollection 2023. PLoS One. 2023. PMID: 37988351 Free PMC article.
-
The chromatin remodeling protein Lsh alters nucleosome occupancy at putative enhancers and modulates binding of lineage specific transcription factors.Epigenetics. 2019 Mar;14(3):277-293. doi: 10.1080/15592294.2019.1582275. Epub 2019 Mar 12. Epigenetics. 2019. PMID: 30861354 Free PMC article.
References
-
- McPherson CE, Shim EY, Friedman DS, Zaret KS. An active tissue-specific enhancer and bound transcription factors existing in a precisely positioned nucleosomal array. Cell. 1993;75:387–98. - PubMed
Publication types
MeSH terms
Substances
Grants and funding
LinkOut - more resources
Full Text Sources
Molecular Biology Databases
Research Materials
Miscellaneous

