

Comparison of UTCI to selected thermal indices
- PMID: 21614619
- PMCID: PMC3337419
- DOI: 10.1007/s00484-011-0453-2
Comparison of UTCI to selected thermal indices
Abstract
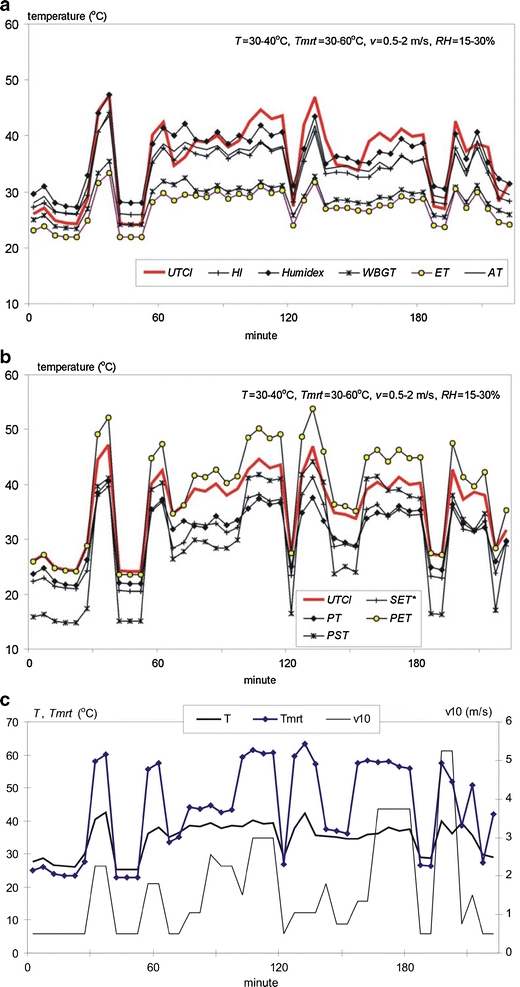
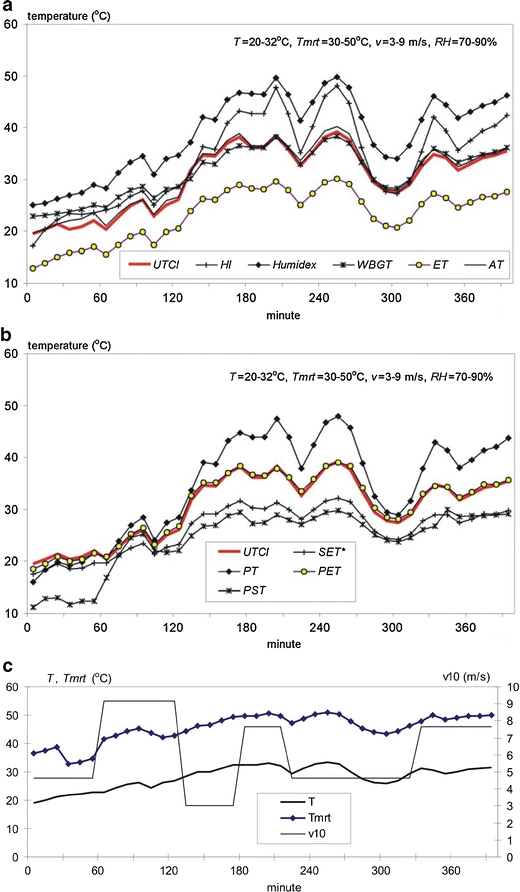
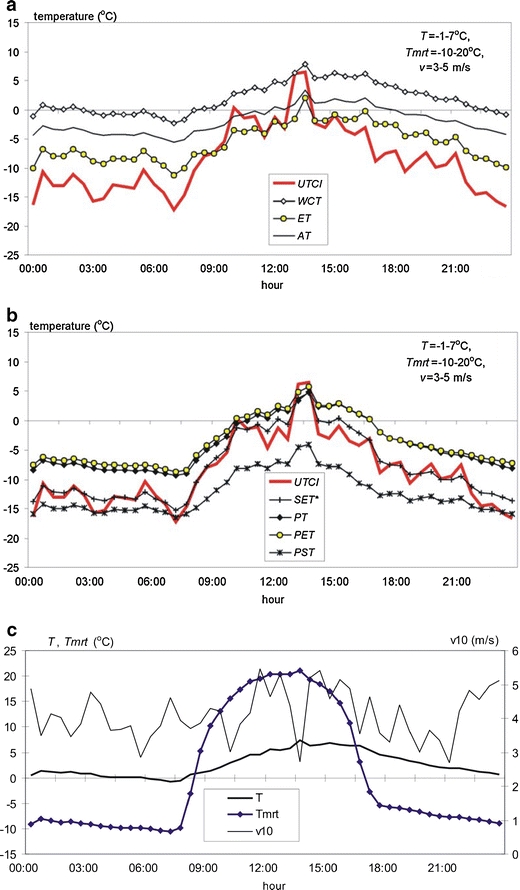
Over the past century more than 100 indices have been developed and used to assess bioclimatic conditions for human beings. The majority of these indices are used sporadically or for specific purposes. Some are based on generalized results of measurements (wind chill, cooling power, wet bulb temperature) and some on the empirically observed reactions of the human body to thermal stress (physiological strain, effective temperature). Those indices that are based on human heat balance considerations are referred to as "rational indices". Several simple human heat balance models are known and are used in research and practice. This paper presents a comparative analysis of the newly developed Universal Thermal Climate Index (UTCI), and some of the more prevalent thermal indices. The analysis is based on three groups of data: global data-set, synoptic datasets from Europe, and local scale data from special measurement campaigns of COST Action 730. We found the present indices to express bioclimatic conditions reasonably only under specific meteorological situations, while the UTCI represents specific climates, weather, and locations much better. Furthermore, similar to the human body, the UTCI is very sensitive to changes in ambient stimuli: temperature, solar radiation, wind and humidity. UTCI depicts temporal variability of thermal conditions better than other indices. The UTCI scale is able to express even slight differences in the intensity of meteorological stimuli.
Figures

Similar articles
-
Comparing the efficacy of different climate indices for prediction of labor loss, body temperatures, and thermal perception in a wide variety of warm and hot climates.J Appl Physiol (1985). 2024 Aug 1;137(2):312-328. doi: 10.1152/japplphysiol.00613.2023. Epub 2024 Jun 13. J Appl Physiol (1985). 2024. PMID: 38867664
-
Thermal comfort in Quebec City, Canada: sensitivity analysis of the UTCI and other popular thermal comfort indices in a mid-latitude continental city.Int J Biometeorol. 2016 Apr;60(4):591-603. doi: 10.1007/s00484-015-1054-2. Epub 2015 Sep 8. Int J Biometeorol. 2016. PMID: 26349476
-
UTCI--why another thermal index?Int J Biometeorol. 2012 May;56(3):421-8. doi: 10.1007/s00484-011-0513-7. Epub 2011 Dec 21. Int J Biometeorol. 2012. PMID: 22187087
-
The Universal Thermal Climate Index UTCI compared to ergonomics standards for assessing the thermal environment.Ind Health. 2013;51(1):16-24. doi: 10.2486/indhealth.2012-0098. Ind Health. 2013. PMID: 23411753 Review.
-
Outdoor human thermal perception in various climates: A comprehensive review of approaches, methods and quantification.Sci Total Environ. 2018 Aug 1;631-632:390-406. doi: 10.1016/j.scitotenv.2018.02.276. Epub 2018 Mar 16. Sci Total Environ. 2018. PMID: 29525717 Review.
Cited by
-
Bioclimatic conditions of the Lower Silesia region (South-West Poland) from 1966 to 2017.Int J Biometeorol. 2021 Sep;65(9):1515-1527. doi: 10.1007/s00484-020-01970-5. Epub 2020 Oct 1. Int J Biometeorol. 2021. PMID: 33001277 Free PMC article.
-
A high temporal resolution global gridded dataset of human thermal stress metrics.Sci Data. 2024 Oct 10;11(1):1116. doi: 10.1038/s41597-024-03966-x. Sci Data. 2024. PMID: 39390007 Free PMC article.
-
The influence of meteorological factors on the technical performance of football teams during matches.Biol Sport. 2024 Oct;41(4):165-172. doi: 10.5114/biolsport.2024.136091. Epub 2024 Apr 25. Biol Sport. 2024. PMID: 39416501 Free PMC article.
-
Universal Thermal Climate Index (UTCI) and adverse pregnancy outcomes in Ahvaz, Iran.Reprod Health. 2022 Feb 2;19(1):33. doi: 10.1186/s12978-022-01344-7. Reprod Health. 2022. PMID: 35109854 Free PMC article.
-
Urban heat indicator map for climate adaptation planning.Mitig Adapt Strateg Glob Chang. 2018;23(2):169-185. doi: 10.1007/s11027-015-9669-5. Epub 2015 Jul 22. Mitig Adapt Strateg Glob Chang. 2018. PMID: 30093828 Free PMC article.
References
-
- ACGIH . TLVs and BELs: threshold limit values for chemical substances and physical agents and biological exposure indices. Cincinnati: ACGIH; 2004. pp. 168–176.
-
- AIHA . Heating and cooling for man in industry. 2. Arkon: American Industrial Hygiene Association; 1975. Heat exchange and human tolerance limits; pp. 5–28.
-
- Armstrong LE, Epstein Y, Greenleaf JE, Haymes EM, Hubbard RW, Roberts WO, Thompson PD. ACSM Position stand: heat and cold illnesses during distance running. Med Sci Sports Exerc. 1996;28(12):i–x. - PubMed
-
- ASHRAE (1997) American Society of Heating, Refrigerating and Air Conditioning Engineers Handbook Fundamentals Volume, Chap. 8. Thermal Comfort, 8.1–8.28
Publication types
MeSH terms
LinkOut - more resources
Full Text Sources
Miscellaneous
