Transcriptomic analysis of autistic brain reveals convergent molecular pathology
- PMID: 21614001
- PMCID: PMC3607626
- DOI: 10.1038/nature10110
Transcriptomic analysis of autistic brain reveals convergent molecular pathology
Abstract
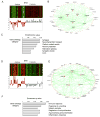
Autism spectrum disorder (ASD) is a common, highly heritable neurodevelopmental condition characterized by marked genetic heterogeneity. Thus, a fundamental question is whether autism represents an aetiologically heterogeneous disorder in which the myriad genetic or environmental risk factors perturb common underlying molecular pathways in the brain. Here, we demonstrate consistent differences in transcriptome organization between autistic and normal brain by gene co-expression network analysis. Remarkably, regional patterns of gene expression that typically distinguish frontal and temporal cortex are significantly attenuated in the ASD brain, suggesting abnormalities in cortical patterning. We further identify discrete modules of co-expressed genes associated with autism: a neuronal module enriched for known autism susceptibility genes, including the neuronal specific splicing factor A2BP1 (also known as FOX1), and a module enriched for immune genes and glial markers. Using high-throughput RNA sequencing we demonstrate dysregulated splicing of A2BP1-dependent alternative exons in the ASD brain. Moreover, using a published autism genome-wide association study (GWAS) data set, we show that the neuronal module is enriched for genetically associated variants, providing independent support for the causal involvement of these genes in autism. In contrast, the immune-glial module showed no enrichment for autism GWAS signals, indicating a non-genetic aetiology for this process. Collectively, our results provide strong evidence for convergent molecular abnormalities in ASD, and implicate transcriptional and splicing dysregulation as underlying mechanisms of neuronal dysfunction in this disorder.
Figures


Comment in
-
Autism: converging pathways.Nat Rev Neurosci. 2011 Jun 8;12(7):372. doi: 10.1038/nrn3062. Nat Rev Neurosci. 2011. PMID: 21654704 No abstract available.
-
Gene expression: The autism disconnect.Nature. 2011 Jun 15;474(7351):294-5. doi: 10.1038/474294a. Nature. 2011. PMID: 21677744 No abstract available.
-
Disease genetics: converging models for autism.Nat Rev Genet. 2011 Jun 17;12(7):456-7. doi: 10.1038/nrg3022. Nat Rev Genet. 2011. PMID: 21681205 No abstract available.
Similar articles
-
Genome-wide changes in lncRNA, splicing, and regional gene expression patterns in autism.Nature. 2016 Dec 15;540(7633):423-427. doi: 10.1038/nature20612. Epub 2016 Dec 5. Nature. 2016. PMID: 27919067 Free PMC article.
-
Patterning of regional gene expression in autism: new complexity.Sci Rep. 2013;3:1831. doi: 10.1038/srep01831. Sci Rep. 2013. PMID: 23665920 Free PMC article.
-
Genome-wide DNA methylation profiling identifies convergent molecular signatures associated with idiopathic and syndromic autism in post-mortem human brain tissue.Hum Mol Genet. 2019 Jul 1;28(13):2201-2211. doi: 10.1093/hmg/ddz052. Hum Mol Genet. 2019. PMID: 31220268 Free PMC article.
-
Autism susceptibility genes and the transcriptional landscape of the human brain.Int Rev Neurobiol. 2013;113:303-18. doi: 10.1016/B978-0-12-418700-9.00010-1. Int Rev Neurobiol. 2013. PMID: 24290390 Review.
-
Autism spectrum disorder: insights into convergent mechanisms from transcriptomics.Nat Rev Genet. 2019 Jan;20(1):51-63. doi: 10.1038/s41576-018-0066-2. Nat Rev Genet. 2019. PMID: 30390048 Review.
Cited by
-
Unsupervised Learning and Multipartite Network Models: A Promising Approach for Understanding Traditional Medicine.Front Pharmacol. 2020 Aug 26;11:1319. doi: 10.3389/fphar.2020.01319. eCollection 2020. Front Pharmacol. 2020. PMID: 32982738 Free PMC article. Review.
-
Gene networks specific for innate immunity define post-traumatic stress disorder.Mol Psychiatry. 2015 Dec;20(12):1538-45. doi: 10.1038/mp.2015.9. Epub 2015 Mar 10. Mol Psychiatry. 2015. PMID: 25754082 Free PMC article.
-
Evolutionary and biomedical implications of sex differences in the primate brain transcriptome.Cell Genom. 2024 Jul 10;4(7):100589. doi: 10.1016/j.xgen.2024.100589. Epub 2024 Jun 27. Cell Genom. 2024. PMID: 38942023 Free PMC article.
-
Tracks through the genome to physiological events.Exp Physiol. 2015 Dec;100(12):1429-40. doi: 10.1113/EP085129. Epub 2015 Jul 19. Exp Physiol. 2015. PMID: 26053180 Free PMC article. Review.
-
Cellular reprogramming: a novel tool for investigating autism spectrum disorders.Trends Mol Med. 2012 Aug;18(8):463-71. doi: 10.1016/j.molmed.2012.06.002. Epub 2012 Jul 6. Trends Mol Med. 2012. PMID: 22771169 Free PMC article. Review.
References
-
- Amaral DG, Schumann CM, Nordahl CW. Neuroanatomy of autism. Trends Neurosci. 2008;31:137–145. - PubMed
Publication types
MeSH terms
Substances
Associated data
- Actions
Grants and funding
- R01 MH081754-01/MH/NIMH NIH HHS/United States
- 5R01MH081754-03/MH/NIMH NIH HHS/United States
- R37 MH060233-11/MH/NIMH NIH HHS/United States
- R37 MH060233/MH/NIMH NIH HHS/United States
- R01 MH081754-03/MH/NIMH NIH HHS/United States
- R37 MH060233-12/MH/NIMH NIH HHS/United States
- R01 MH081754-05/MH/NIMH NIH HHS/United States
- R01 MH081754/MH/NIMH NIH HHS/United States
- R37MH060233/MH/NIMH NIH HHS/United States
- R01 MH081754-04/MH/NIMH NIH HHS/United States
- R01 MH094714/MH/NIMH NIH HHS/United States
- R01 MH081754-02/MH/NIMH NIH HHS/United States
- CAPMC/ CIHR/Canada
LinkOut - more resources
Full Text Sources
Other Literature Sources

