. 2011 May 24;30(13):2662-74.
doi: 10.1038/emboj.2011.159.

Snail1, Snail2, and E47 promote mammary epithelial branching morphogenesis

Affiliations

Snail1, Snail2, and E47 promote mammary epithelial branching morphogenesis

Kangae Lee et al. EMBO J. .

Abstract

Several E-box-binding transcription factors regulate individual and collective cell migration and enhance the motility of epithelial cells by promoting epithelial-mesenchymal transition (EMT). Here, we characterized the role of a subset of these transcription factors and the EMT proteome in branching morphogenesis of mammary epithelial tissues using a three-dimensional organotypic culture model of the mammary duct. We found that the transcription factors Snail1, Snail2, and E47 were transiently upregulated at branch sites; decreasing the expression of these transcription factors inhibited branching. Conversely, ectopic expression of Snail1, Snail2, and E47 induced branching in the absence of exogenous stimuli. These changes correlated with the expression of mesenchymal markers and repression of E-cadherin, which was essential for branching. Snail1 and Snail2 also promoted cell survival at branch sites, but this was not sufficient to induce branching. These findings indicate that Snail1, Snail2, and E47 can promote collective migration during branching morphogenesis of mammary epithelial tissues through key regulators of EMT.


Conflict of interest statement

The authors declare that they have no conflict of interest.

Figures
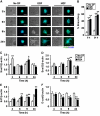
Figure 1
Figure 1
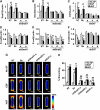
Snail1, Snail2, and E47 mRNA levels are transiently increased during EGF- or HGF-induced branching morphogenesis. (A) Clusters of mammary epithelial cells were embedded in collagen gel and treated with no growth factor (No GF), EGF, or HGF and monitored for branching at 3, 6, 9, and 24 h. Shown are nuclei (blue) and actin (green). Scale bars, 100 μm. (B) Quantification of the percentage of branching from 20 clusters for No GF, EGF, or HGF treatment; shown are mean±s.e.m. (n=3 independent experiments). **P<0.01 versus No GF (two-way ANOVA with Bonferroni comparison). (CF) Total RNA was isolated at indicated times and used to determine the mRNA levels of (C) Snail1, (D) Snail2, (E) E47, and (F) E-cadherin by qRT–PCR. The mRNA levels were normalized to the levels of β-actin in each sample and each value was expressed relative to the levels in No GF; shown are mean±s.e.m. (n=3). *P<0.05; **P<0.01 versus 3 h No GF (two-way ANOVA with Bonferroni comparison).
Figure 2
Figure 2
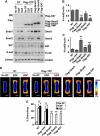
Snail1, Snail2, and E47 are increased at branch sites. (A) Microfabricated mammary epithelial tubules were treated with no growth factor (No GF), EGF, or HGF for 24 h. Phase contrast images and frequency maps of 60 tubules stained for nuclei are shown. Scale bars, 50 μm. Colour bars indicate frequency. (B) Branching was quantified by measuring the pixel intensity 12 μm away from the tip of tubules; shown are mean±s.e.m. (n=5). **P<0.01 versus No GF (one-way ANOVA with Bonferroni comparison). (C) Microfabricated mammary epithelial tubules were treated with No GF or EGF for 8 h and stained for Snail1, Snail2, or E47. Scale bars, 50 μm. (D) Frequency maps of 50 tubules stained for Snail1, Snail2, E47, or vimentin. Scale bars, 50 μm. Colour bars indicate frequency. (E) Microfabricated mammary epithelial tubules were treated with No GF or EGF for 8 or 24 h and stained for E-cadherin. Scale bars, 50 μm.
Figure 3
Figure 3
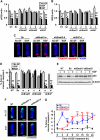
Loss of Snail1, Snail2, or E47 represses branching morphogenesis. (AF) Mammary epithelial cells were transfected with two independent shSnail1, three independent shSnail2, three independent shE47, scrambled shRNA (Sc), or no shRNA cassette (NT). After 48 h, transfected cells were treated with no growth factor (No GF), EGF, or HGF for 9 h. Total RNA was isolated for determination of (A) Snail1, (B) Snail2, (C) E47, or (DF) E-cadherin mRNA levels by qRT–PCR. The mRNA levels were normalized to the levels of β-actin in each sample and each value was expressed relative to the levels in No GF of scrambled shRNA transfected cells (Sc); plotted are mean±s.e.m. (n=3). *P<0.05; **P<0.01 versus Sc (No GF) (two-way ANOVA with Bonferroni comparison). (G) Mammary epithelial cells were transfected with shSnail1, shSnail2, shE47, Sc, or NT and used to generate microfabricated mammary epithelial tubules. Tubules were treated with No GF, EGF, or HGF for 24 h. Frequency maps of branching from 50 tubules are shown. Scale bars, 50 μm. Colour bar indicates frequency. (H) Branching was quantified as described above; shown are mean±s.e.m. (n=5). All results were confirmed with at least two independent shRNA constructs for each gene. **P<0.01 versus NT (No GF); ##P<0.01 versus Sc (EGF) (two-way ANOVA with Bonferroni comparison).
Figure 4
Figure 4
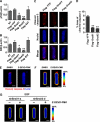
Snail1, Snail2, and E47 induce mammary epithelial branching morphogenesis. (AC) Mammary epithelial cells were transfected with Flag-tagged Snail1, Snail2, E47, YFP, or nothing (NT). (A) Total protein was assayed by immunoblot to determine the expression levels of Snail1, Snail2, E47, or E-cadherin. Total RNA was isolated for determination of (B) E-cadherin or (C) N-cadherin mRNA levels by qRT–PCR. The mRNA levels were normalized to the levels of β-actin in each sample and each value was expressed relative to the levels in Flag-tagged YFP transfected cells; shown are mean±s.e.m. (n=4). *P<0.05; **P<0.01 versus Flag-tagged YFP (one-way ANOVA with Bonferroni comparison). (D) Mammary epithelial cells were transfected with Flag-tagged Snail1, Snail2, E47, YFP, or NT and used to generate microfabricated mammary epithelial tubules. Frequency maps of branching from 50 tubules are shown. Scale bars, 50 μm. Colour bar indicates frequency. (E) Branching was quantified as described above; shown are mean±s.e.m. (n=5). **P<0.01 versus NT (No GF) (two-way ANOVA with Bonferroni comparison).
Figure 5
Figure 5
Loss of Snail1 or Snail2 leads to apoptotic cell death at branch sites during mammary epithelial branching morphogenesis. (A, B) Mammary epithelial cells were transfected with shSnail1, shSnail2, shE47, or scrambled shRNA (Sc). After 48 h, transfected cells were treated with no growth factor (No GF), EGF, or HGF for 9 h. Total RNA was isolated for determination of (A) p53 and (B) BID mRNA levels using qRT–PCR. The mRNA levels were normalized to the levels of β-actin in each sample and each value was expressed relative to the levels in No GF of scrambled shRNA transfected cells; shown are mean±s.e.m. (n=3). **P<0.01 versus SC (No GF) (two-way ANOVA with Bonferroni comparison). (C) Mammary epithelial cells were transfected with shSnail1, shSnail2, shE47, or scrambled shRNA (Sc) and used to generate microfabricated mammary epithelial tubules. Tubules were treated with No GF, EGF, or HGF for 20 h and fixed and stained for cleaved caspase-3 and nuclei. Scale bars, 50 μm. (D) Percent area of active caspase-3 was quantified by measuring cleaved caspase-3-positive areas in 25 tubules from at least three independent experiments; shown are mean±s.e.m. **P<0.01 versus NT (No GF) (two-way ANOVA with Bonferroni comparison). (E) Mammary epithelial cells were transfected with shSnail1, shSnail2, scrambled RNA (Sc), or nothing (NT). After 24 h, cells were treated with or without EGF. Total protein was analysed by immunoblot to determine the expression levels of p53 or β-actin. (F) Microfabricated mammary epithelial tubules were generated and treated with or without EGF and stained for p53. Scale bars, 50 μm. (G) Microfabricated mammary epithelial tubules were generated and treated with EGF for the indicated time. Percent area of cleaved caspase-3 in scrambled RNA (Sc), shSnail1, or shSnail2-transfected samples was quantified as described above; shown are mean±s.e.m. (n=30). *P<0.05; **P<0.01 versus Sc (0 h) (two-way ANOVA with Bonferroni comparison).
Figure 6
Figure 6
Inhibition of apoptosis by Snail1 or Snail2 is not sufficient to induce mammary branching morphogenesis. (A, B) Mammary epithelial cells were transfected with Flag-tagged Snail1, Snail2, E47, YFP, or nothing (NT). Total RNA was isolated for determination of (A) p53 and (B) BID mRNA levels using qRT–PCR. The mRNA levels were normalized to the levels of β-actin in each sample and each value was expressed relative to the levels in Flag-tagged YFP; shown are mean±s.e.m. (n=4). *P<0.05; **P<0.01 versus Flag–YFP (one-way ANOVA with Bonferroni comparison). (C) Mammary epithelial cells were transfected with Flag-tagged Snail1, Snail2, or YFP and used to generate microfabricated mammary epithelial tubules. Tubules were cultured for 20 h and stained for cleaved caspase-3 and nuclei. Scale bars, 50 μm. (D) Percent area of cleaved caspase-3 was quantified as described above; shown are mean±s.e.m. (n=30). **P<0.01 versus Flag-tagged YFP (one-way ANOVA with Bonferroni comparison). (E, F) Microfabricated mammary epithelial tubules were treated with caspase-3 inhibitor (Z-DEVD-FMK, 20 μM) or vehicle (DMSO). (E) Tubules stained for cleaved caspase-3 (red) and nuclei (blue) and (F) frequency maps of 50 tubules are shown. Scale bars, 50 μm. (G) Microfabricated mammary epithelial tubules generated from cells transfected with shSnail1-a or shSnail2-d were treated with caspase-3 inhibitor (Z-DEVD-FMK, 20 μM) or vehicle. Frequency maps of branching from 50 tubules are shown. Scale bars, 50 μm. Colour bar indicates frequency.
Figure 7
Figure 7
Repressing E-cadherin expression is required for branching morphogenesis. (A) Mammary epithelial cells were transfected with E-cadherin or empty vector (EV) and incubated with EGF or HGF for 24 h. Total protein was assayed by immunoblot to determine the expression levels of E-cadherin. (B) Relative intensity of bands in immunoblots shown in panel (A). **P<0.01 versus EV of each treatment (Student's t-test). (C) Mammary epithelial cells were transfected with E-cadherin or EV and used to generate microfabricated mammary epithelial tubules. Frequency maps of branching from 50 tubules are shown. Scale bars, 50 μm. Colour bar indicates frequency. (D) Branching was quantified as described above; shown are mean±s.e.m. (n=4). **P<0.01 versus EV (No GF); ##P<0.01 versus EV (EGF) (two-way ANOVA with Bonferroni comparison). (E) Mammary epithelial cells were co-transfected with Flag-tagged Snail1 and E-cadherin or EV. Total protein was assayed by immunoblot to determine the expression levels of Snail1 or E-cadherin. (F) Mammary epithelial cells were co-transfected with Flag-tagged Snail1 and E-cadherin or EV and used to generate microfabricated mammary epithelial tubules. Frequency maps of branching from 50 tubules are shown. Scale bars, 50 μm. Colour bar indicates frequency. (G) Branching was quantified as described above; shown are mean±s.e.m. (n=4). **P<0.01 versus NT (one-way ANOVA with Bonferroni comparison). (H) Mammary epithelial cells were co-transfected with Flag-tagged E47 and E-cadherin or EV. Total protein was assayed by immunoblot to determine the expression levels of E47 or E-cadherin. (I) Mammary epithelial cells co-transfected with Flag-tagged E47 and E-cadherin or EV were used to generate microfabricated mammary epithelial tubules. Frequency maps of branching from 50 tubules are shown. Scale bars, 50 μm. Colour bar indicates frequency. (J) Branching was quantified as described above; shown are mean±s.e.m. (n=4). **P<0.01 versus NT (one-way ANOVA with Bonferroni comparison).
Figure 8
Figure 8
The role of Snail1, Snail2, and E47 in mammary epithelial branching morphogenesis. Mammary epithelial tissues are quiescent in the absence of exogenous stimuli. In response to growth factor stimulation, mammary epithelial cells located at branch sites express Snail1, Snail2, and E47 to induce expression of mesenchymal markers and promote cell survival. Consequently mammary epithelial cells initiate branching.

Similar articles

Cited by

References

    1. Aman A, Piotrowski T (2010) Cell migration during morphogenesis. Dev Biol 341: 20–33 - PubMed
    1. Barrallo-Gimeno A, Nieto MA (2005) The Snail genes as inducers of cell movement and survival: implications in development and cancer. Development 132: 3151–3161 - PubMed
    1. Brinkmann V, Foroutan H, Sachs M, Weidner KM, Birchmeier W (1995) Hepatocyte growth factor/scatter factor induces a variety of tissue-specific morphogenic programs in epithelial cells. J Cell Biol 131: 1573–1586 - PMC - PubMed
    1. Cano A, Perez-Moreno MA, Rodrigo I, Locascio A, Blanco MJ, del Barrio MG, Portillo F, Nieto MA (2000) The transcription factor snail controls epithelial-mesenchymal transitions by repressing E-cadherin expression. Nat Cell Biol 2: 76–83 - PubMed
    1. Carver EA, Jiang R, Lan Y, Oram KF, Gridley T (2001) The mouse Snail gene encodes a key regulator of the epithelial-mesenchymal transition. Mol Cell Biol 21: 8184–8188 - PMC - PubMed

Publication types

MeSH terms