

Nicotinic acid adenine dinucleotide phosphate (NAADP) regulates autophagy in cultured astrocytes
- PMID: 21610076
- PMCID: PMC3151033
- DOI: 10.1074/jbc.C110.216580
Nicotinic acid adenine dinucleotide phosphate (NAADP) regulates autophagy in cultured astrocytes
Abstract
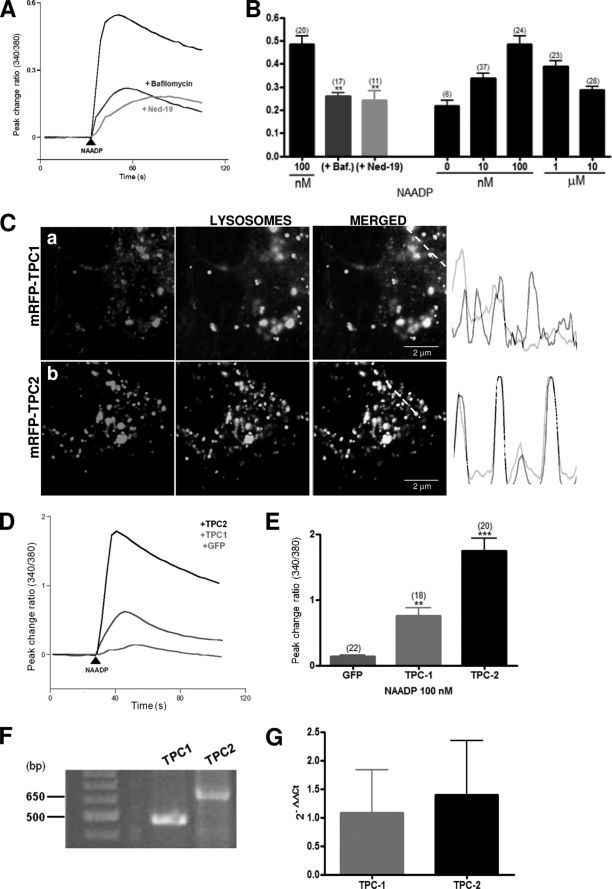
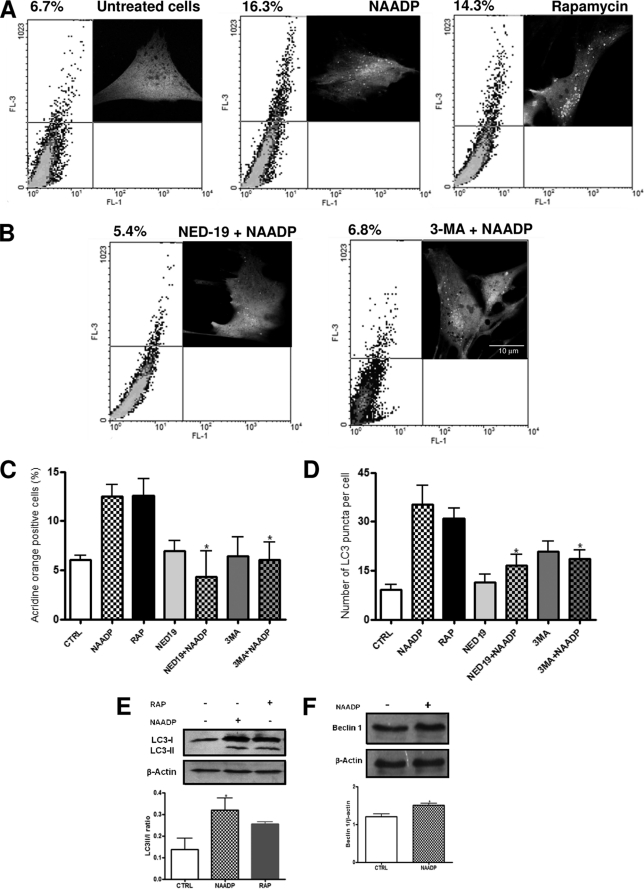
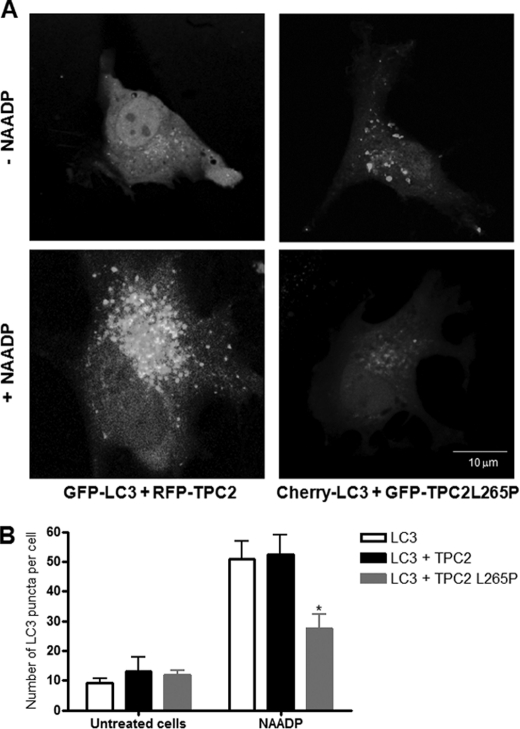
Nicotinic acid adenine dinucleotide phosphate (NAADP) is a potent Ca(2+)-mobilizing messenger that in many cells releases Ca(2+) from the endolysosomal system. Recent studies have shown that NAADP-induced Ca(2+) mobilization is mediated by the two-pore channels (TPCs). Whether NAADP acts as a messenger in astrocytes is unclear, and downstream functional consequences have yet to be defined. Here, we show that intracellular delivery of NAADP evokes Ca(2+) signals from acidic organelles in rat astrocytes and that these signals are potentiated upon overexpression of TPCs. We also show that NAADP increases acidic vesicular organelle formation and levels of the autophagic markers, LC3II and beclin-1. NAADP-mediated increases in LC3II levels were reduced in cells expressing a dominant-negative TPC2 construct. Our data provide evidence that NAADP-evoked Ca(2+) signals mediated by TPCs regulate autophagy.
Figures
Similar articles
-
Nicotinic acid adenine dinucleotide phosphate (NAADP) activates global and heterogeneous local Ca2+ signals from NAADP- and ryanodine receptor-gated Ca2+ stores in pulmonary arterial myocytes.J Biol Chem. 2013 Apr 12;288(15):10381-94. doi: 10.1074/jbc.M112.423053. Epub 2013 Feb 26. J Biol Chem. 2013. PMID: 23443655 Free PMC article.
-
Nicotinic Acid Adenine Dinucleotide Phosphate (NAADP) and Endolysosomal Two-pore Channels Modulate Membrane Excitability and Stimulus-Secretion Coupling in Mouse Pancreatic β Cells.J Biol Chem. 2015 Aug 28;290(35):21376-92. doi: 10.1074/jbc.M115.671248. Epub 2015 Jul 7. J Biol Chem. 2015. PMID: 26152717 Free PMC article.
-
NAADP as an intracellular messenger regulating lysosomal calcium-release channels.Biochem Soc Trans. 2010 Dec;38(6):1424-31. doi: 10.1042/BST0381424. Biochem Soc Trans. 2010. PMID: 21118101
-
TPCs: Endolysosomal channels for Ca2+ mobilization from acidic organelles triggered by NAADP.FEBS Lett. 2010 May 17;584(10):1966-74. doi: 10.1016/j.febslet.2010.02.028. Epub 2010 Feb 14. FEBS Lett. 2010. PMID: 20159015 Free PMC article. Review.
-
Integration of nicotinic acid adenine dinucleotide phosphate (NAADP)-dependent calcium signalling.J Physiol. 2018 Jul;596(14):2735-2743. doi: 10.1113/JP275974. Epub 2018 Apr 26. J Physiol. 2018. PMID: 29635794 Free PMC article. Review.
Cited by
-
Cyclic ADP-ribose and nicotinic acid adenine dinucleotide phosphate (NAADP) as messengers for calcium mobilization.J Biol Chem. 2012 Sep 14;287(38):31633-40. doi: 10.1074/jbc.R112.349464. Epub 2012 Jul 20. J Biol Chem. 2012. PMID: 22822066 Free PMC article. Review.
-
NAADP-induced intracellular calcium ion is mediated by the TPCs (two-pore channels) in hypoxia-induced pulmonary arterial hypertension.J Cell Mol Med. 2021 Aug;25(15):7485-7499. doi: 10.1111/jcmm.16783. Epub 2021 Jul 15. J Cell Mol Med. 2021. PMID: 34263977 Free PMC article.
-
Endolysosomal two-pore channels regulate autophagy in cardiomyocytes.J Physiol. 2016 Jun 1;594(11):3061-77. doi: 10.1113/JP271332. Epub 2016 Feb 4. J Physiol. 2016. PMID: 26757341 Free PMC article.
-
Unveiling the Interplay-Vitamin D and ACE-2 Molecular Interactions in Mitigating Complications and Deaths from SARS-CoV-2.Biology (Basel). 2024 Oct 16;13(10):831. doi: 10.3390/biology13100831. Biology (Basel). 2024. PMID: 39452140 Free PMC article. Review.
-
Two-pore channels (TPCs): Novel voltage-gated ion channels with pleiotropic functions.Channels (Austin). 2017 Jan 2;11(1):20-33. doi: 10.1080/19336950.2016.1213929. Epub 2016 Jul 20. Channels (Austin). 2017. PMID: 27440385 Free PMC article. Review.
References
Publication types
MeSH terms
Substances
Grants and funding
LinkOut - more resources
Full Text Sources
Miscellaneous
