

Structural basis of Rnd1 binding to plexin Rho GTPase binding domains (RBDs)
- PMID: 21610070
- PMCID: PMC3138255
- DOI: 10.1074/jbc.M110.197053
Structural basis of Rnd1 binding to plexin Rho GTPase binding domains (RBDs)
Abstract
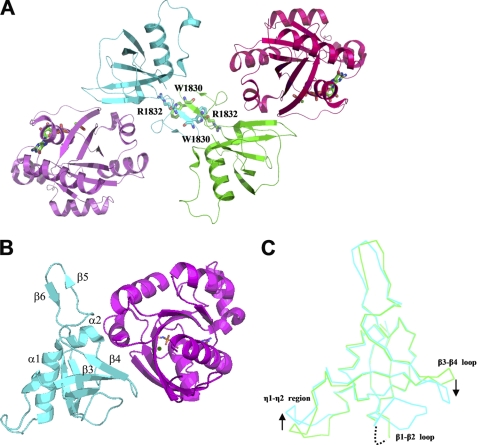
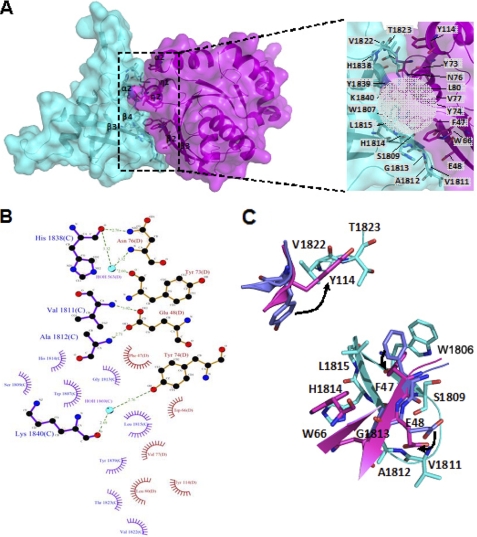
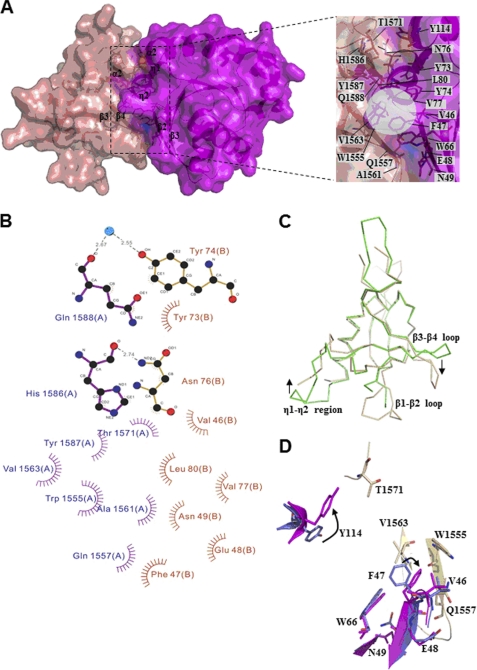
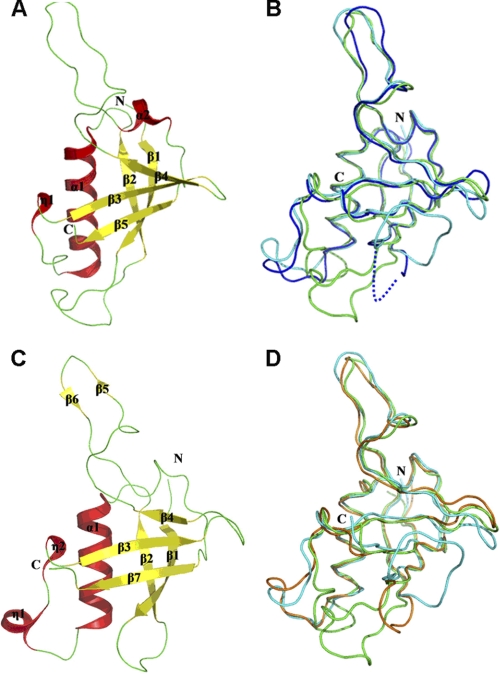
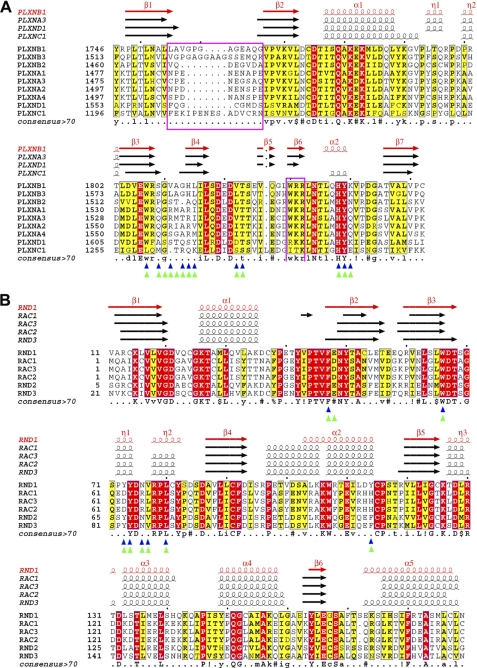
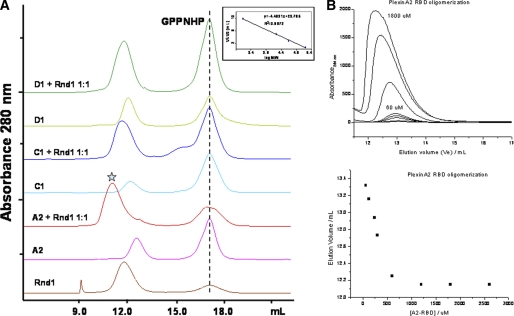
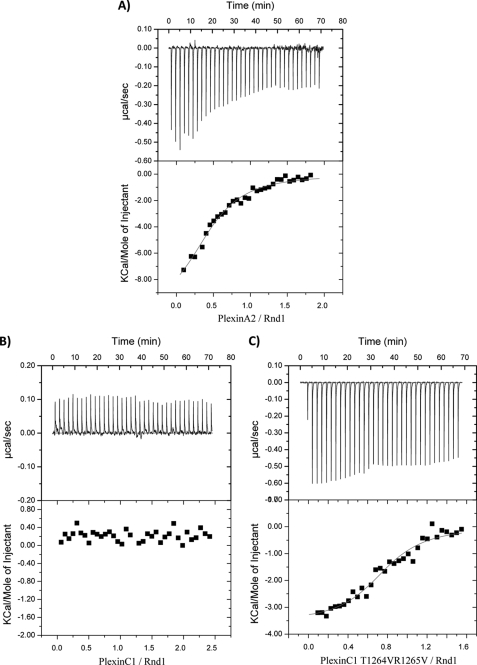
Plexin receptors regulate cell adhesion, migration, and guidance. The Rho GTPase binding domain (RBD) of plexin-A1 and -B1 can bind GTPases, including Rnd1. By contrast, plexin-C1 and -D1 reportedly bind Rnd2 but associate with Rnd1 only weakly. The structural basis of this differential Rnd1 GTPase binding to plexin RBDs remains unclear. Here, we solved the structure of the plexin-A2 RBD in complex with Rnd1 and the structures of the plexin-C1 and plexin-D1 RBDs alone, also compared with the previously determined plexin-B1 RBD.Rnd1 complex structure. The plexin-A2 RBD·Rnd1 complex is a heterodimer, whereas plexin-B1 and -A2 RBDs homodimerize at high concentration in solution, consistent with a proposed model for plexin activation. Plexin-C1 and -D1 RBDs are monomeric, consistent with major residue changes in the homodimerization loop. In plexin-A2 and -B1, the RBD β3-β4 loop adjusts its conformation to allow Rnd1 binding, whereas minimal structural changes occur in Rnd1. The plexin-C1 and -D1 RBDs lack several key non-polar residues at the corresponding GTPase binding surface and do not significantly interact with Rnd1. Isothermal titration calorimetry measurements on plexin-C1 and -D1 mutants reveal that the introduction of non-polar residues in this loop generates affinity for Rnd1. Structure and sequence comparisons suggest a similar mode of Rnd1 binding to the RBDs, whereas mutagenesis suggests that the interface with the highly homologous Rnd2 GTPase is different in detail. Our results confirm, from a structural perspective, that Rnd1 does not play a role in the activation of plexin-C1 and -D1. Plexin functions appear to be regulated by subfamily-specific mechanisms, some of which involve different Rho family GTPases.
Figures
Similar articles
-
Molecular Dynamics Simulations Reveal Isoform Specific Contact Dynamics between the Plexin Rho GTPase Binding Domain (RBD) and Small Rho GTPases Rac1 and Rnd1.J Phys Chem B. 2017 Feb 23;121(7):1485-1498. doi: 10.1021/acs.jpcb.6b11022. Epub 2017 Feb 8. J Phys Chem B. 2017. PMID: 28103666 Free PMC article.
-
Thermodynamic characterization of two homologous protein complexes: associations of the semaphorin receptor plexin-B1 RhoGTPase binding domain with Rnd1 and active Rac1.Protein Sci. 2009 May;18(5):1060-71. doi: 10.1002/pro.116. Protein Sci. 2009. PMID: 19388051 Free PMC article.
-
Analysis of the interaction of Plexin-B1 and Plexin-B2 with Rnd family proteins.PLoS One. 2017 Oct 17;12(10):e0185899. doi: 10.1371/journal.pone.0185899. eCollection 2017. PLoS One. 2017. PMID: 29040270 Free PMC article.
-
Plexin structures are coming: opportunities for multilevel investigations of semaphorin guidance receptors, their cell signaling mechanisms, and functions.Cell Mol Life Sci. 2012 Nov;69(22):3765-805. doi: 10.1007/s00018-012-1019-0. Epub 2012 Jun 29. Cell Mol Life Sci. 2012. PMID: 22744749 Free PMC article. Review.
-
GTPases in semaphorin signaling.Adv Exp Med Biol. 2007;600:12-23. doi: 10.1007/978-0-387-70956-7_2. Adv Exp Med Biol. 2007. PMID: 17607943 Review.
Cited by
-
Plexin-A1 expression in the inhibitory neurons of infralimbic cortex regulates the specificity of fear memory in male mice.Neuropsychopharmacology. 2022 May;47(6):1220-1230. doi: 10.1038/s41386-021-01177-1. Epub 2021 Sep 10. Neuropsychopharmacology. 2022. PMID: 34508226 Free PMC article.
-
Rnd3-induced cell rounding requires interaction with Plexin-B2.J Cell Sci. 2016 Nov 1;129(21):4046-4056. doi: 10.1242/jcs.192211. Epub 2016 Sep 21. J Cell Sci. 2016. PMID: 27656111 Free PMC article.
-
Reduction of NgR in perforant path decreases amyloid-β peptide production and ameliorates synaptic and cognitive deficits in APP/PS1 mice.Alzheimers Res Ther. 2020 Apr 24;12(1):47. doi: 10.1186/s13195-020-00616-3. Alzheimers Res Ther. 2020. PMID: 32331528 Free PMC article.
-
Class A Plexins Are Organized as Preformed Inactive Dimers on the Cell Surface.Biophys J. 2015 Nov 3;109(9):1937-45. doi: 10.1016/j.bpj.2015.04.043. Biophys J. 2015. PMID: 26536270 Free PMC article.
-
Modeling transmembrane domain dimers/trimers of plexin receptors: implications for mechanisms of signal transmission across the membrane.PLoS One. 2015 Apr 2;10(4):e0121513. doi: 10.1371/journal.pone.0121513. eCollection 2015. PLoS One. 2015. PMID: 25837709 Free PMC article.
References
-
- Tamagnone L., Artigiani S., Chen H., He Z., Ming G. I., Song H., Chedotal A., Winberg M. L., Goodman C. S., Poo M., Tessier-Lavigne M., Comoglio P. M. (1999) Cell 99, 71–80 - PubMed
-
- Patel B. N., Van Vactor D. L. (2002) Curr. Opin. Cell Biol. 14, 221–229 - PubMed
-
- Gitler A. D., Lu M. M., Epstein J. A. (2004) Dev. Cell 7, 107–116 - PubMed
-
- Serini G., Valdembri D., Zanivan S., Morterra G., Burkhardt C., Caccavari F., Zammataro L., Primo L., Tamagnone L., Logan M., Tessier-Lavigne M., Taniguchi M., Püschel A. W., Bussolino F. (2003) Nature 424, 391–397 - PubMed
Publication types
MeSH terms
Substances
Associated data
- Actions
- Actions
- Actions
Grants and funding
LinkOut - more resources
Full Text Sources
