. 2011 Jul;60(7):1861-71.
doi: 10.2337/db11-0030. Epub 2011 May 18.

Farnesoid X receptor deficiency improves glucose homeostasis in mouse models of obesity

Affiliations

Farnesoid X receptor deficiency improves glucose homeostasis in mouse models of obesity

Janne Prawitt et al. Diabetes. 2011 Jul.

Abstract

Objective: Bile acids (BA) participate in the maintenance of metabolic homeostasis acting through different signaling pathways. The nuclear BA receptor farnesoid X receptor (FXR) regulates pathways in BA, lipid, glucose, and energy metabolism, which become dysregulated in obesity. However, the role of FXR in obesity and associated complications, such as dyslipidemia and insulin resistance, has not been directly assessed.

Research design and methods: Here, we evaluate the consequences of FXR deficiency on body weight development, lipid metabolism, and insulin resistance in murine models of genetic and diet-induced obesity.

Results: FXR deficiency attenuated body weight gain and reduced adipose tissue mass in both models. Surprisingly, glucose homeostasis improved as a result of an enhanced glucose clearance and adipose tissue insulin sensitivity. In contrast, hepatic insulin sensitivity did not change, and liver steatosis aggravated as a result of the repression of β-oxidation genes. In agreement, liver-specific FXR deficiency did not protect from diet-induced obesity and insulin resistance, indicating a role for nonhepatic FXR in the control of glucose homeostasis in obesity. Decreasing elevated plasma BA concentrations in obese FXR-deficient mice by administration of the BA sequestrant colesevelam improved glucose homeostasis in a FXR-dependent manner, indicating that the observed improvements by FXR deficiency are not a result of indirect effects of altered BA metabolism.

Conclusions: Overall, FXR deficiency in obesity beneficially affects body weight development and glucose homeostasis.


Figures

FIG. 1.
FIG. 1.
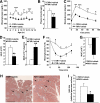
FXR deficiency attenuates weight gain in ob/ob mice. A: FXR+/+ob/ob (white bars and symbols) and FXR−/−ob/ob mice (black bars and symbols) (n = 9 to 10/group) were monitored weekly for body weight. Significance of the overall effect of genotype (P < 0.0001) and age (P < 0.0001) as well as their interaction (P < 0.0001) was calculated by two-way ANOVA. B: Body composition was assessed by dual-energy X-ray absorptiometry in 20-week-old mice (n = 9 to 10/group). Vo2 (C) and Vco2 (D) were determined in 20-week-old mice (n = 5/group) individually housed in metabolic cages. Values are means ± SEM. Differences between genotypes over time were analyzed by two-way ANOVA and Bonferroni post hoc test; differences between genotypes were calculated by Mann-Whitney test (*P = 0.05, **P < 0.01, ***P < 0.001).
FIG. 2.
FIG. 2.
FXR deficiency improves glucose homeostasis in ob/ob mice. A: Fasting blood glucose was measured weekly in FXR+/+ob/ob (white bars or circles) and FXR−/−ob/ob mice (black bars or circles) (n = 9 to 10/group). Significance of the overall effect of the genotype (P < 0.0001) was calculated by two-way ANOVA. B: Plasma insulin was determined in 12-week-old mice (n = 9 to 10/group). Blood glucose excursion (C) and integrated AUC (D) after administration of an intraperitoneal glucose bolus (1 g/kg glucose) were measured in 12-week-old mice (n = 9 to 10/group). Significance of the overall effect of genotype (P < 0.0001) and time (P < 0.0001) was calculated by two-way ANOVA. E: MCR was determined by stable isotope dilution in 14-week-old mice (n = 5 to 6/group). Blood glucose excursion (F) and iAUC (G) after administration of an intraperitoneal insulin bolus (2 IU insulin/kg) were measured in 13-week-old mice (n = 9 to 10/group). Significance of the overall effect of genotype (P < 0.0001) and time (P < 0.0001) was calculated by two-way ANOVA. H: Pancreata of 20-week-old mice (n = 9 to 10/group) were sectioned and submitted to Papanicolaou staining. Arrows indicate islets of Langerhans (scale bar = 1 mm). I: Mean surface of the islets of Langerhans was quantified. Values are means ± SEM. Differences between genotypes over time were analyzed by two-way ANOVA and Bonferroni post hoc test; differences between genotypes were calculated by Mann-Whitney test (*P = 0.05, **P < 0.01, ***P < 0.001). (A high-quality digital representation of this figure is available in the online issue.)
FIG. 3.
FIG. 3.
FXR deficiency improves adipose tissue, but not hepatic insulin sensitivity in ob/ob mice. A: Female FXR+/+ob/ob (13-week-old; white bars) and FXR−/−ob/ob mice (black bars) (n = 4/group) were injected with either saline or insulin. Phosphorylation of Akt at Serine473 and total Akt protein expression was determined by Western blot and the signal quantified. B: Gene expression was measured by QPCR. C: Triglyceride content was determined enzymatically in livers of 20-week-old mice (n = 9 to 10/group). Values are means ± SEM. Differences between genotypes were calculated by Mann-Whitney test (*P < 0.05, **P < 0.01, ***P < 0.001). WAT, white adipose tissue; pAkt, Serine473-phosphorylated Akt; TG, triglyceride.
FIG. 4.
FIG. 4.
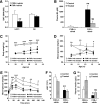
FXR deficiency in ob/ob mice results in the accumulation of plasma triglycerides. A and B: Lipid parameters were measured in plasma of 12-week-old FXR+/+ob/ob (white bars or circles) and FXR−/−ob/ob mice (black bars or circles) (n = 9 to 10/group). C: Lipoprotein profiles were determined in plasma pools of 13-week-old mice. D: VLDL production was assessed in 13-week-old female mice (n = 8–10/group) by measuring plasma triglyceride concentrations subsequent to Tyloxapol injection. E: Gene expression was measured by QPCR in livers of 20-week-old mice (n = 9 to 10/group). Values are means ± SEM. Differences between genotypes were calculated by Mann-Whitney test (***P < 0.001). FFA, free fatty acid; OD, optical density; TG, triglyceride.
FIG. 5.
FIG. 5.
FXR deficiency protects from diet-induced obesity and insulin resistance. FXR+/+ (white bars or circles) and FXR−/− mice (black bars or circles) (n = 7–11/group) were fed a HFD for 20 weeks. A: Body weight was monitored weekly (n = 7–11/group). Significance of the overall effect of genotype (P < 0.0001) and age (P < 0.0001) as well as their interaction (P < 0.0001) was calculated by two-way ANOVA. Plasma leptin (B), plasma triglyceride (TG) (C), blood glucose (D), and plasma insulin (E) were determined at the end of the feeding period (n = 4–9/group). Blood glucose excursion (F) and integrated AUC (G) after administration of an intraperitoneal glucose bolus (1 g/kg glucose) were measured at the end of the feeding period (n = 6–9/group). Significance of the overall effect of genotype (P < 0.0001) and time (P < 0.0001) was calculated by two-way ANOVA. Values are means ± SEM. Differences between genotypes over time were analyzed by two-way ANOVA and Bonferroni post hoc test; differences between genotypes were calculated by Mann-Whitney test (*P < 0.05, **P < 0.01, ***P < 0.001).
FIG. 6.
FIG. 6.
Liver-specific FXR deficiency does not protect from diet-induced obesity and insulin resistance. LFXR−/− mice and LFXR+/+ littermates (n = 7–12/group) were fed a HFD or a control diet (CD) for 10 weeks (LFXR+/+, white bars and symbols; LFXR−/−, black bars and symbols). A: Body weight was monitored weekly. Significance of the effect of diet (P < 0.0001) and age (P < 0.0001) as well as their interaction (P < 0.0001) was calculated by two-way ANOVA. Plasma leptin (B) and plasma triglyceride (TG) (C) were determined at the end of the feeding period. D: Fasting blood glucose was measured weekly. Significance of the overall effect of diet (P < 0.0001) and age (P < 0.0001) as well as their interaction (P = 0.0217) was calculated by two-way ANOVA. E: Plasma insulin was measured after 6 weeks of feeding. Blood glucose excursion (F) and integrated AUC (G) after administration of an intraperitoneal glucose bolus (1 g/kg glucose) were measured after 5 weeks of feeding (n = 6/group). Values are means ± SEM. Differences between diet groups over time were analyzed by two-way ANOVA and Bonferroni post hoc test; differences between genotypes or diet groups were calculated by Mann-Whitney test. *Compares genotypes of the same diet group; $compares diet groups for LFXR+/+; §compares diet groups for LFXR−/− ($ or §P < 0.05; **, $$, or §§P < 0.01; $$$ or §§§P < 0.001).
FIG. 7.
FIG. 7.
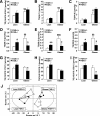
Modulation of BA metabolism does not affect glucose homeostasis in FXR−/−ob/ob mice. FXR+/+ob/ob and FXR−/−ob/ob mice (10 weeks old) were administered 2% colesevelam mixed in the diet or plain diet for 3 weeks (n = 13/group) (FXR+/+ob/ob control, white bars or circles; FXR+/+ob/ob treated, horizontally hatched bars or white squares; FXR−/−ob/ob control, black bars or circles; FXR−/−ob/ob treated, diagonally hatched bars or black squares). A: TGR5 target gene expression was measured by QPCR in BAT of 20-week-old mice (n = 9 to 10/group). B: Plasma BA were measured after 9 days of treatment. C: Body weight was monitored weekly during the treatment period. Significance of the overall effect of treatment (P < 0.0001) and age (P = 0.0002) was calculated by two-way ANOVA. D: Fasting blood glucose was determined weekly during the treatment period. Blood glucose excursion (E) and integrated AUC (F) after administration of an intraperitoneal glucose bolus (1 g/kg glucose) were measured at the end of the treatment period. G: Plasma insulin was measured at the end of the treatment period. Values are means ± SEM. Differences between treatment groups over time were analyzed by two-way ANOVA and Bonferroni post hoc test; differences between genotypes or treatment groups were calculated by Mann-Whitney test. *Compares genotypes of the same treatment group; $compares treatment groups of the same genotype (* or $P < 0.05, ** or $$P < 0.01, ***P < 0.001).
FIG. 8.
FIG. 8.
FXR deficiency differentially affects the abundance of long-chain, unsaturated triglyceride (TG) species in adipose tissue of lean and obese mice. Lipidomic analysis was performed in white adipose tissue of 6-week-old FXR+/+ob/ob, FXR−/−ob/ob mice, as well as lean FXR+/+ and FXR−/− littermates (lean FXR+/+, white bars or squares; lean FXR−/−, black bars or squares; obese FXR+/+, white bars or circles; obese FXR−/−, black bars or circles). Representative data for AC: Medium-chain triglycerides with a high saturation level. DF: Long-chain, highly unsaturated triglycerides. GI: Long-chain triglycerides containing few double-bounds. J: PLS/DA of all measured lipid species. Values are means ± SEM. Differences between genotypes were calculated by one-way ANOVA and Student t test. *Compares the effect of leptin-deficiency; $compares the effect of FXR deficiency (* or $P < 0.05, ** or $$P < 0.01, or $$$P <0.001).

Similar articles

Cited by

References

    1. Cornier MA, Dabelea D, Hernandez TL, et al. The metabolic syndrome. Endocr Rev 2008;29:777–822 - PMC - PubMed
    1. Lefebvre P, Cariou B, Lien F, Kuipers F, Staels B. Role of bile acids and bile acid receptors in metabolic regulation. Physiol Rev 2009;89:147–191 - PubMed
    1. Prawitt J, Caron S, Staels B. How to modulate FXR activity to treat the metabolic syndrome. Drug Discov Today Dis Mech 2009;6:e55–e64
    1. Watanabe M, Houten SM, Wang L, et al. Bile acids lower triglyceride levels via a pathway involving FXR, SHP, and SREBP-1c. J Clin Invest 2004;113:1408–1418 - PMC - PubMed
    1. Kast HR, Nguyen CM, Sinal CJ, et al. Farnesoid X-activated receptor induces apolipoprotein C-II transcription: a molecular mechanism linking plasma triglyceride levels to bile acids. Mol Endocrinol 2001;15:1720–1728 - PubMed

Publication types