. 2011 Jul 22;286(29):26028-41.
doi: 10.1074/jbc.M110.188987. Epub 2011 May 13.

A hierarchical whole-body modeling approach elucidates the link between in Vitro insulin signaling and in Vivo glucose homeostasis

Affiliations

A hierarchical whole-body modeling approach elucidates the link between in Vitro insulin signaling and in Vivo glucose homeostasis

Elin Nyman et al. J Biol Chem. .

Abstract

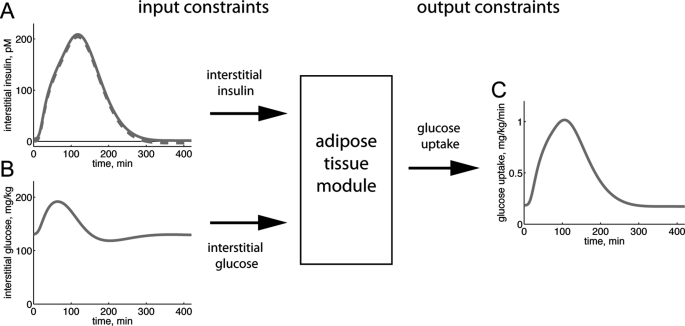
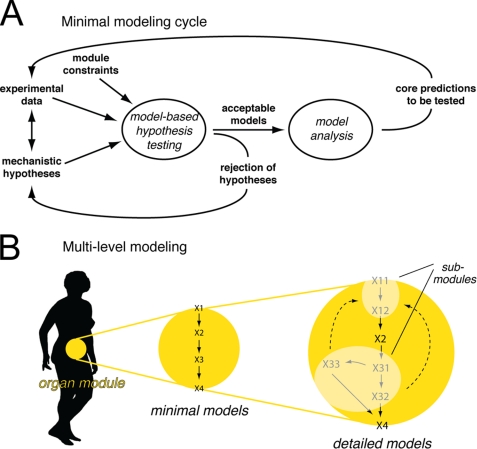
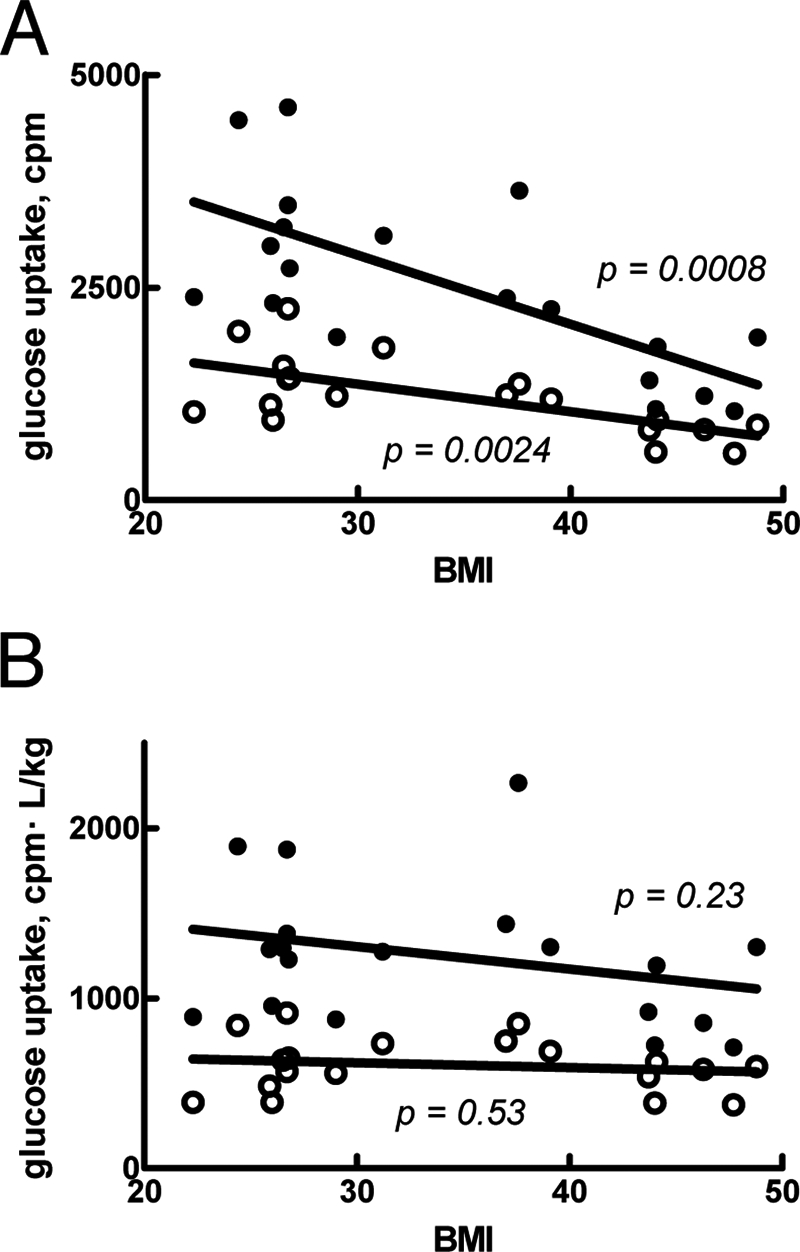
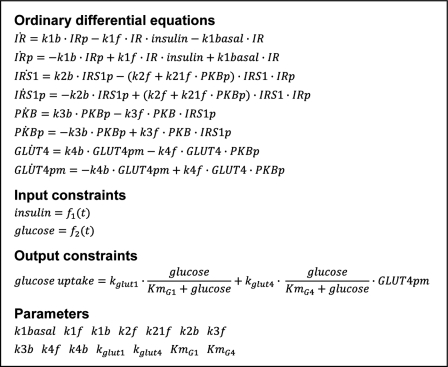
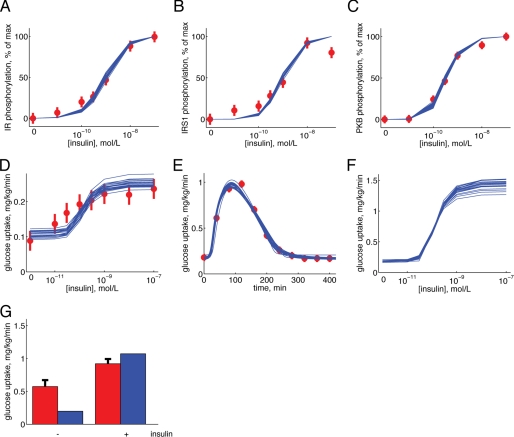
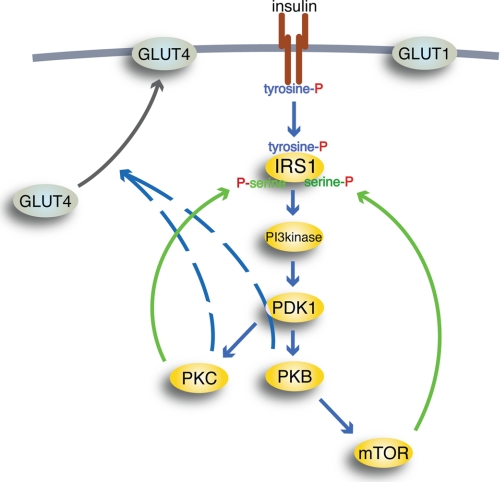
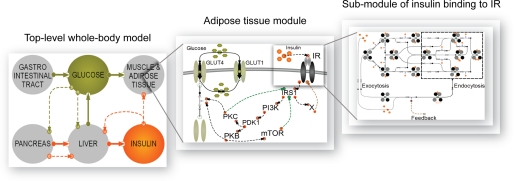
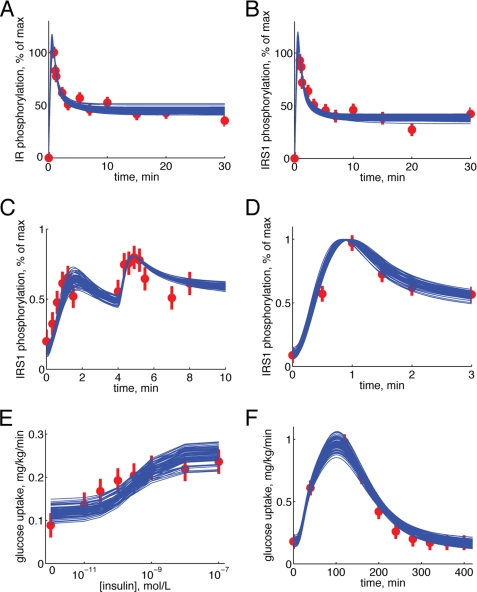
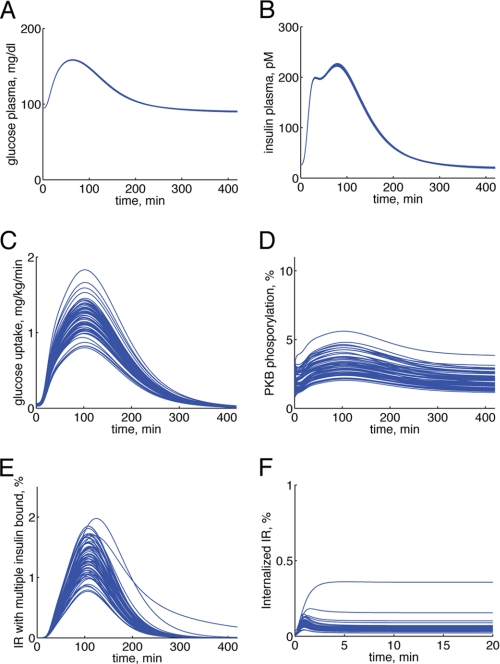
Type 2 diabetes is a metabolic disease that profoundly affects energy homeostasis. The disease involves failure at several levels and subsystems and is characterized by insulin resistance in target cells and tissues (i.e. by impaired intracellular insulin signaling). We have previously used an iterative experimental-theoretical approach to unravel the early insulin signaling events in primary human adipocytes. That study, like most insulin signaling studies, is based on in vitro experimental examination of cells, and the in vivo relevance of such studies for human beings has not been systematically examined. Herein, we develop a hierarchical model of the adipose tissue, which links intracellular insulin control of glucose transport in human primary adipocytes with whole-body glucose homeostasis. An iterative approach between experiments and minimal modeling allowed us to conclude that it is not possible to scale up the experimentally determined glucose uptake by the isolated adipocytes to match the glucose uptake profile of the adipose tissue in vivo. However, a model that additionally includes insulin effects on blood flow in the adipose tissue and GLUT4 translocation due to cell handling can explain all data, but neither of these additions is sufficient independently. We also extend the minimal model to include hierarchical dynamic links to more detailed models (both to our own models and to those by others), which act as submodules that can be turned on or off. The resulting multilevel hierarchical model can merge detailed results on different subsystems into a coherent understanding of whole-body glucose homeostasis. This hierarchical modeling can potentially create bridges between other experimental model systems and the in vivo human situation and offers a framework for systematic evaluation of the physiological relevance of in vitro obtained molecular/cellular experimental data.


Figures

FIGURE 1.
FIGURE 1.
Module constraints. The behavior of an adipose tissue module inserted in a whole-body model is governed by input and output constraints. Input constraints are used as inputs to the module, and the resulting output of the model must fit the output constraints. A and B, input constraints from the Dalla Man model in response to a meal (15). A, dashed line, interstitial insulin concentration; solid line, our modified interstitial insulin concentration that is restricted to positive values. B, interstitial glucose concentration. C, output constraints calculated from the Dalla Man model in response to a meal; rate of glucose uptake by the adipose tissue module.
FIGURE 2.
FIGURE 2.
Modeling strategy. In the minimal modeling cycle (A), mechanistic hypotheses are tested against experimental data sets, and conclusions are drawn. Conclusions are in the form of core predictions (uniquely identified predictions) and rejected hypotheses. Non-rejected (i.e. acceptable) minimal models can be included as organ modules when creating multilevel models (B), provided that the module constraints are fulfilled. The minimal model can further be extended with more details, as long as the submodules fit their relevant module constraints. The result is a hierarchical multilevel model with optional submodules of varying complexity.
FIGURE 3.
FIGURE 3.
Glucose uptake by isolated adipocytes in relation to BMI. A, rate of glucose uptake, with (filled circles) or without (open circles) 100 nm insulin, in relation to BMI of the individual cell donor. B, rate of glucose uptake, with (filled circles) or without (open circles) 100 nm insulin, multiplied by the fat tissue volume (in liters, calculated as described under “Materials and Methods”) and divided by body weight (in kg) of the individual cell donor. Indicated are p values for correlation between rate of glucose uptake and BMI.
FIGURE 4.
FIGURE 4.
Example of model equations. The model equations for Ma2 demonstrate how the models are formulated. The states are the simulated signaling proteins that are phosphorylated (indicated with p) or non-phosphorylated. Insulin and glucose, the input constraints, are functions of time. Glucose uptake, the output constraint, is given by an expression depending both on insulin (via GLUT4 in the plasma membrane (GLUT4pm)) and glucose. The model parameters (i.e. the rate constants) are searched for in the optimization process while fitting models to experimental data and output constraints. The complete model equations for all models are available as supplemental material.
FIGURE 5.
FIGURE 5.
Simulations by model Ma2 in comparison with data sets Z1 and Z2. A–D, dose response to increasing concentrations of insulin. A, IR phosphorylation; B, IRS1 phosphorylation; C, PKB phosphorylation; D, glucose uptake. Simulated results are depicted as blue solid lines (one line for each extreme acceptable parameter set), and experimental data are depicted as red filled circles with error bars (±S.E.). Experimental data are from isolated adipocytes. E, glucose uptake of the adipose tissue in response to a meal. Simulated results are depicted as blue solid lines (one line for each extreme acceptable parameter set), and experimental data are depicted as red filled circles with error bars (±S.E.). Experimental data are from the Dalla Man model (15). F, predicted glucose uptake (blue solid lines) with 5 mm glucose in the medium. G, experimentally determined (red bars, ±S.E.) versus fitted/simulated (blue bars) glucose uptake for the isolated adipocytes in the presence of 5 mm glucose, with or without 100 nm insulin, as indicated.
FIGURE 6.
FIGURE 6.
Schematic outline of insulin signaling pathways. Insulin binding to the IR (brown) causes autophosphorylation of IR at tyrosine; thus activated, IR will phosphorylate IRS1 at tyrosine to create binding sites for Src homology 2 domain-containing proteins, such as PI3K (PI3kinase). Thus activated, PI3K will phosphorylate phosphoinositides in the cell membrane, allowing PDK1 to phosphorylate and activate PKB and PKCλ/ζ (PKC). Thus activated, PKB can activate mTOR in complex with raptor, through which insulin can control protein synthesis, autophagy, and mitochondrial function. mTOR and protein kinase PKCλ/ζ relay feedback signals (green) to phosphorylation of IRS1 at serine residues. Blue arrows, downstream signaling by insulin; black arrow, translocation of insulin-regulated GLUT4 from an intracellular location to the plasma membrane (thick gray line); hatched lines, poorly defined signal paths; P, phosphate. GLUT1 is not affected by insulin.
FIGURE 7.
FIGURE 7.
Hierarchical, module-based modeling; the final multilevel model M3. The left panel depicts the top level part of the model, which is the glucose/insulin whole-body model from Ref. , but with an adipose tissue module extracted from the original single insulin-dependent tissue. The adipose tissue module in the middle panel is expanded to show the next level of the model, insulin signaling to enhanced glucose uptake via the GLUT4 translocation. In the right panel, insulin binding to IR is expanded with the insulin-IR binding model from Ref. and the insulin-IR internalization/feedback model from Ref. . Together, all three panels constitute the final hierarchical model, M3.
FIGURE 8.
FIGURE 8.
Simulations of the final hierarchical model M3 compared with data set Z3. Simulated results are depicted as blue solid lines (one line for each extreme acceptable parameter set), and experimental data are depicted as red filled circles with error bars (±S.E.). A, IR phosphorylation in response to 100 nm insulin. Experimental data are from isolated adipocytes. B, IRS1 phosphorylation in response to 100 nm insulin. Experimental data are from isolated adipocytes. C, IRS1 phosphorylation in response to the first 1.2 nm at 0 min and then 10 nm insulin at 4 min. Experimental data are from isolated adipocytes. D, IRS1 phosphorylation in response to 10 nm insulin. Experimental data are from isolated adipocytes. E, dose response for glucose uptake in response to increasing concentrations of insulin. Experimental data are from isolated adipocytes. F, glucose uptake by the adipose tissue in response to a meal. Experimental data are from the Dalla Man model (15).
FIGURE 9.
FIGURE 9.
Simulations/core predictions of the final hierarchical model M3. Simulations of the final hierarchical model (M3) for each extreme acceptable parameter set of the adipose tissue module can be used as core predictions (uniquely identifiable predictions) to draw conclusions. Here are some examples of such simulations (one blue line for each extreme acceptable parameter set) from different levels of the model: plasma glucose concentration (A), plasma insulin concentration (B), glucose uptake in the adipose tissue module (C), PKB phosphorylation in adipose tissue module (D), the fraction of IR states with two or three insulin molecules bound in the submodule of insulin binding to IR (E), and the fraction of internalized IR in the submodule of insulin binding to IR (F).

Similar articles

Cited by

References

    1. Herman M. A., Kahn B. B. (2006) J. Clin. Invest. 116, 1767–1775 - PMC - PubMed
    1. Borisov N., Aksamitiene E., Kiyatkin A., Legewie S., Berkhout J., Maiwald T., Kaimachnikov N. P., Timmer J., Hoek J. B., Kholodenko B. N. (2009) Mol. Syst. Biol. 5, 256 - PMC - PubMed
    1. Martin T. J., May J. M. (1986) J. Recept. Res. 6, 323–336 - PubMed
    1. Wanant S., Quon M. J. (2000) J. Theor. Biol. 205, 355–364 - PubMed
    1. Kiselyov V. V., Versteyhe S., Gauguin L., De Meyts P. (2009) Mol. Syst. Biol. 5, 243 - PMC - PubMed

Publication types