. 2011 May 27;145(5):758-72.
doi: 10.1016/j.cell.2011.03.052. Epub 2011 May 12.

Enhanced polyubiquitination of Shank3 and NMDA receptor in a mouse model of autism

Affiliations

Enhanced polyubiquitination of Shank3 and NMDA receptor in a mouse model of autism

M Ali Bangash et al. Cell. .

Retraction in

Abstract

We have created a mouse genetic model that mimics a human mutation of Shank3 that deletes the C terminus and is associated with autism. Expressed as a single copy [Shank3(+/ΔC) mice], Shank3ΔC protein interacts with the wild-type (WT) gene product and results in >90% reduction of Shank3 at synapses. This "gain-of-function" phenotype is linked to increased polyubiquitination of WT Shank3 and its redistribution into proteasomes. Similarly, the NR1 subunit of the NMDA receptor is reduced at synapses with increased polyubiquitination. Assays of postsynaptic density proteins, spine morphology, and synapse number are unchanged in Shank3(+/ΔC) mice, but the amplitude of NMDAR responses is reduced together with reduced NMDAR-dependent LTP and LTD. Reciprocally, mGluR-dependent LTD is markedly enhanced. Shank3(+/ΔC) mice show behavioral deficits suggestive of autism and reduced NMDA receptor function. These studies reveal a mechanism distinct from haploinsufficiency by which mutations of Shank3 can evoke an autism-like disorder.


Figures

Figure 1
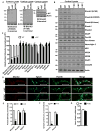
Figure 1. Gain-of function reduction of Shank3 in the Shank3(+/ΔC) mice
A. Representative immunoblots from cortical lysates blotted with JH3025 C-terminal Antibody (Ab), H-160 C-terminal Ab and an N-terminal Ab against Shank3. Multiple bands represent spliced Shank3 variants. Lysates from ΔC/ΔC mouse served as negative control. JH3025 gives a non-specific band ~45kDa. Actin is used as loading control. See also Figure S1J. B. Representative immunoblots from cortical lysates of three independent littermate pairs of WT and Shank3(+/ΔC) mice aged P60. C. Quantification of protein levels in A. n= 3 littermate pairs; **P<0.01; *P<0. D. Representative confocal images from DIV 14–21 cortical cultures co-labeled with Shank3 (JH3025), Psd-95 and Vglut1. Cortical cultures from ΔC/ΔC mice were used as control for Shank3 Ab. (Scale bar, 10μm). E. Quantification of puncta density (see methods) from D. 7000–11,000 μm of dendrites was examined from culture sets from 3 independent littermate pairs; **P<0.01 F. Quantification of synaptic protein per μm from D. Synaptic protein was defined as an area overlap between Shank3 or Psd-95 and the synaptic marker Vglut1. 7000–9,000 μm of dendrites was examined from culture sets from 3 independent littermate pairs; **P<0.01 G. Quantification of brain Shank3 mRNA levels from real-time PCR analysis. n= 3 independent littermate pairs; difference non-significant. All quantitative data are shown as means + SEM. All P values are derived from a Student’s t-test. See also Fig. S1
Figure 2
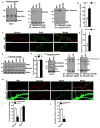
Figure 2. Increased polyubiquitination of Shank3 is mediated by ΔC
A. Co-immunoprecipitation assay from cortical lysates to assess in vivo polyubiquitination of Shank3 in the +/ΔC mouse. Polyubiquitinated Shank3 ran at ~250kD because of added polyubiquitin. Lysates from Shank3(ΔC/ΔC) were used as negative control. B. Quantification of relative Shank3 polyubiquitination from A (normalized to WT). Y-axis is FK1 polyubiquitin signal relative to immunoprecipitated Shank3. n= 3 independent littermate pairs; *P<0.05 C. Representative confocal images from DIV14–21 cortical cultures from WT and Shank3(+/ΔC) co-labeled with Shank3 and the proteasomal marker Rpt6. (Scale bar, 5 μm). D. Quantification of colocalization (area overlap per μm of dendrite) between Shank3 and Rpt6 from C. 5000–7000 μm of dendrites was examined from culture sets from 3 independent littermate pairs; **P<0.01 E. Representative Immunoblot from total cortical lysates showing total Rpt6 levels in WT and Shank3(+/ΔC) mice. F. Quantification of protein levels in E. n= 3 independent littermate pairs; P>0.05 G. Co-immunoprecipitation assay from cortical lysates showing ΔC binds full length Shank3 in vivo. The input lysates were blotted with JH3025 Shank3 (C) and the N-terminal Shank3 Ab (N). Protein samples in the input were immunoprecipitated with Shank3 (H-160) Ab and analyzed for ΔC binding using the N-terminal Shank3 Ab that recognized the ΔC band in the +/ΔC but not the WT lane. NS= non-specific bands. H. Representative confocal images from DIV12–14 WT cortical cultures 24-hrs after Myc-ΔC transient transfection. (Scale bar, 5 μm) I. Quantification of puncta density from H. 5000–7000 μm of dendrites was examined from 3 independent culture sets; **P<0.01 J. Quantification of synaptic protein per μm from H. Synaptic protein was defined as an area overlap between Shank3 and Vglut1. 5000–7000 μm of dendrites was examined from 3 independent culture sets; **P<0.01 All quantitative data are shown as means + SEM. All P values are derived from a Student’s t-test. See also Fig. S2
Figure 3
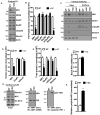
Figure 3. NR1 reduction in the Shank3(+/ΔC) mice is due to enhanced polyubiquitination
A. Representative immunoblots from Cortical P2 (Synaptoneurosomal) fractions from WT and Shank3(+/ΔC) mice aged P42. B. Quantification of protein levels in A. n= 3 independent littermate pairs; **P<0.01; *P<0.05 C. Representative immunoblots from DIV14–21 cortical cultures from two independent WT and Shank3(+/ΔC) sets. Surface samples are from biotinylated lysates immunoprecipitated with avidin. D. Quantification of surface protein levels in C. n= cultures from 3 independent littermate pairs; *P<0.05 E. Quantification of total protein levels in C. n= cultures from 3 independent littermate pairs; *P<0.05 F. Quantification of brain NR1 mRNA levels from real-time PCR analysis. n=3 littermate pairs; difference is non-significant. G. Co-immunoprecipitation assay from cortical lysates to assess in vivo polyubiquitination of NR1 in the Shank3(+/ΔC) mice. H. Quantification of in vivo NR1 polyubiquitination from G. Y-axis is FK1 polyubiquitin signal relative to immunoprecipitated NR1. n= 3 independent littermate pairs; *P<0.05 All quantitative data are shown as means + SEM. All P values are derived from a Student’s t-test. See also Fig. S3
Figure 4
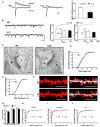
Figure 4. Reduction of NMDAR-mediated synaptic responses in cortex of Shank3(+/ΔC) mice, without changes in spine number or morphology
A. Raw (gray) and averaged (black) traces from a series of 20 consecutive evoked EPSCs in cortical slices. The NMDA/AMPA ratio is diminished in Shank3(+/ΔC) neurons (n=15, 5 mice) compared with WT (n=9, 4 mice). **p<0.005 (Scale bars, 50 pA/50 ms) B. Representative whole cell recording traces and cumulative probability (CP) distribution of AMPA mEPSC amplitude and frequency from all events in WT (n=22) and Shank3(+/ΔC) (n=23) neurons. Differences are non-significant for both amplitude and frequency. Inset: Bar graphs represent the mean amplitude or frequency of each population ± SEM. (Scale bars, 50 pA/0.1 s) C. Exemplar electron micrographs of spine synapses in layer V of the somatosensory cortex from WT and Shank3(+/ΔC) mice showing the presence of the postsynaptic density (arrows), synaptic vesicles (arrowheads) and dendritic spines (asterisks). The following quantifications in D and E are from spine synapses in layer V of the somatosensory cortex. Scale Bar= 100nm. D. The PSD length is not significantly different in the WT and the +/ΔC mice. n= 88 for WT; n= 146 for Shank3(+/ΔC); P>0.05 E. The PSD thickness is not significantly different in the WT and the +/ΔC mice. n= 68 for WT; n= 131 for Shank3(+/ΔC); P>0.05 F. Representative DiI labeled images of layer V pyramidal neurons of the somatosensory cortex from WT and Shank3(+/ΔC) mice. To the right are 3D reconstructions depicting faithful labeling of spines by the filament module in Imaris. (Scale bar, 10 μm). G. Quantification of spine density (spines per μm) in layer V, layer II/III pyramidal neurons of the somatosensory cortex and CA1 pyramidal neurons from WT and Shank3(+/ΔC) mice. n= 9–29 cells from 3 independent littermate pairs. Difference is non-significant. H. Quantification of spine volume in layer V pyramidal neurons of the somatosensory cortex from WT and Shank3(+/ΔC) mice. n=671 spines from 3 independent littermate pairs. P>0.05 I. Quantification of spine volume in layer II/III pyramidal neurons of the somatosensory cortex from WT and Shank3(+/ΔC) mice. n= 2805 spines from 3 independent littermate pairs. P>0.05 J. Quantification of spine volume in CA1 pyramidal neurons from WT and Shank3(+/ΔC) mice. n= 853 spines from 3 independent littermate pairs. P>0.05 All quantitative data are shown as means + SEM. All P values are derived from a Student’s t-test. See also Fig. S4
Figure 5
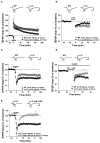
Figure 5. NMDAR-dependent LTP and LTD, and group I mGluR-LTD are altered in hippocampal slices derived from Shank3(+/ΔC) mice
A. HFS-induced LTP is significantly reduced in Shank3(+/ΔC) mice than littermate WT. P<0.005 (Scale bars, 1mV/10 ms) B. NMDAR-dependent LTD of Schaffer collateral-CA1 synapses is reduced in Shank3(+/ΔC) mice. P<0.05 (Scale bars, 1 mV/10 ms) C. mGluR-dependent chemical LTD induced by DHPG is enhanced in Shank3(+/ΔC) mice. P<0.05 (Scale bars, 1 mV/10 ms) D. LTD produced by paired-pulse low-frequency stimulation is increased in the Shank3(+/ΔC) mice. The mean values were significantly different 30 min after stimulation. P<0.05 (Scale bars, 1mV/10 ms) E. mGluR-LTD expressed in Shank3(+/ΔC) mice is completely blocked by protein synthesis inhibitor, cycloheximide (CHX, 60 μM). (Scale bars, 1mV/10 ms) All quantitative data are shown as means + SEM. All P values are derived from a Student’s t-test. See also Fig S5.
Figure 6
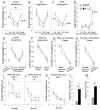
Figure 6. Shank3(+/ΔC) mice display aberrant social behaviors in reciprocal and indirect social interactions
A. Duration of social investigation of a free-roaming stimulus mouse in consecutive trials of the habituation–dishabituation paradigm. Brackets indicate a significant main effect of Genotype (P<0.05), asterisks show between-genotype differences at a particular trial (* P<0.05 and **P<0.01) (n=20 per genotype) B. Social investigation as in (A) for subgroups of Shank3(+/ΔC) (n=9) and WT (n=8) that showed no aggressive behaviors during testing. Difference non-significant. C. Social investigation as in (A) for subgroups of Shank3(+/ΔC) (n=11) and WT (n=12) that showed aggressive behaviors during testing. D. Duration of aggressive behaviors for the groups of mice shown in (C). E. Social investigation of an enclosed stimulus mouse in consecutive trials of the habituation–dishabituation paradigm. No significant differences were found between Shank3(+/ΔC) (n=12) and WT (n=14). The same test mice were used for (E–L). F. Latency to the first aggression episode in a neutral arena and in a test mouse’s home cage. G–H. Duration of investigation of an enclosed male (G) or female (H) mouse and an inanimate empty enclosure. I–J. Dynamics of social investigation of an enclosed male stimulus mouse in novel (I) and familiar environment (J). The 1st (I) and the 4th (J) repetitions of the test are shown. K. Dynamics of social investigation of an enclosed female stimulus mouse in familiar environment. The test was conducted in the same environment as (I–J). No between-genotype differences were observed. L. Latency of the first approach to an enclosed female measured during the test shown in (H) and (K). Shank3(+/ΔC) mice (n=12) took significantly longer to approach the social stimulus than WT (n=14) (Student’s t-test, P<0.05). M. Latencies to the first ultrasound call emitted by Shank3(+/ΔC) mice (n=11) in the presence of a free-roaming female were significantly longer than WT (n=11) (Student’s t-test, P<0.05). Brackets in (A) and (I–J) indicate a significant main effect of Genotype (P<0.05), asterisks in (A)–(M) show between-genotype differences at a particular trial (* P<0.05 and **P<0.01). See also Fig. S6, Table S2 and the online supplemental methods.
Figure 7
Figure 7. Shank3(+/ΔC) mice display schizophrenia-related behavioral phenotypes but preserved spatial and fear memories
A. Amplitude of acoustic startle reaction as a function of stimulus intensity. Asterisks indicate that amplitudes of reactions to startle stimuli (110 or 120dB) in Shank3(+/ΔC) mice (n=12) were significantly lower than WT (n=14) (P<0.001). The stimuli used as prepulses (68 and 72dB) did not evoke startle reactivity in either of the genotypes. B. Raw means of prepulse inhibition uncorrected for differences in startle reactivity between Shank3(+/ΔC) and WT. C–D. Scatterplots of the startle amplitude (X axis) and levels of prepulse inhibition (Y axis) in trials with a 120 dB startle stimulus for WT (C) and Shank3(+/ΔC) (D) mice. Thick and thin lines show linear regression lines fitted to the data from the trials with 4 or 8 dB prepulse, respectively. Pearson correlations between these variables were significant for WT but not Shank3(+/ΔC) mice (see Tables S3). E. Means of prepulse inhibition in WT and Shank3(+/ΔC) mice corrected by ANCOVA for significantly different levels of startle amplitude. Asterisk shows a significant between-genotype difference (P<0.01). F–G. Motor activation (F) and dose-response (G) to MK-801. Area under the curve (G) was calculated from (F) as a total motor activity 15 min after an injection. Asterisks show a significant between-genotype difference (P<0.001). WT n=8,8,8 and Shank3+/ΔC n=6,8,8 for MK-801 doses 0, 0.2 and 0.3 mg/kg, respectively. H–I. Motor activation (H) and dose-response (I) to amphetamine. Asterisk indicates a significant between-genotype difference (P<0.05). WT n=8,13,5 and Shank3(+/ΔC) n=6,11,6 for amphetamine doses 0, 2 and 3 mg/kg, respectively. See also Fig. S7 and Table S3.

Similar articles

Cited by

References

    1. Bear MF, Huber KM, Warren ST. The mGluR theory of fragile X mental retardation. Trends Neurosci. 2004;27:370–377. - PubMed
    1. Beneken J, Tu JC, Xiao B, Nuriya M, Yuan JP, Worley PF, Leahy DJ. Structure of the Homer EVH1 domain-peptide complex reveals a new twist in polyproline recognition. Neuron. 2000;26:143–154. - PubMed
    1. Bonaglia MC, Giorda R, Borgatti R, Felisari G, Gagliardi C, Selicorni A, Zuffardi O. Disruption of the ProSAP2 gene in a t(12;22)(q24.1;q13.3) is associated with the 22q13.3 deletion syndrome. Am J Hum Genet. 2001;69:261–268. - PMC - PubMed
    1. Brakeman PR, Lanahan AA, O’Brien R, Roche K, Barnes CA, Huganir RL, Worley PF. Homer: a protein that selectively binds metabotropic glutamate receptors. Nature. 1997;386:284–288. - PubMed
    1. Condra JA, Neibergs H, Wei W, Brennan MD. Evidence for two schizophrenia susceptibility genes on chromosome 22q13. Psychiatr Genet. 2007;17:292–298. - PubMed

Publication types

MeSH terms

LinkOut - more resources