

COX-2 and fatty acid amide hydrolase can regulate the time course of depolarization-induced suppression of excitation
- PMID: 21564090
- PMCID: PMC3230814
- DOI: 10.1111/j.1476-5381.2011.01486.x
COX-2 and fatty acid amide hydrolase can regulate the time course of depolarization-induced suppression of excitation
Abstract
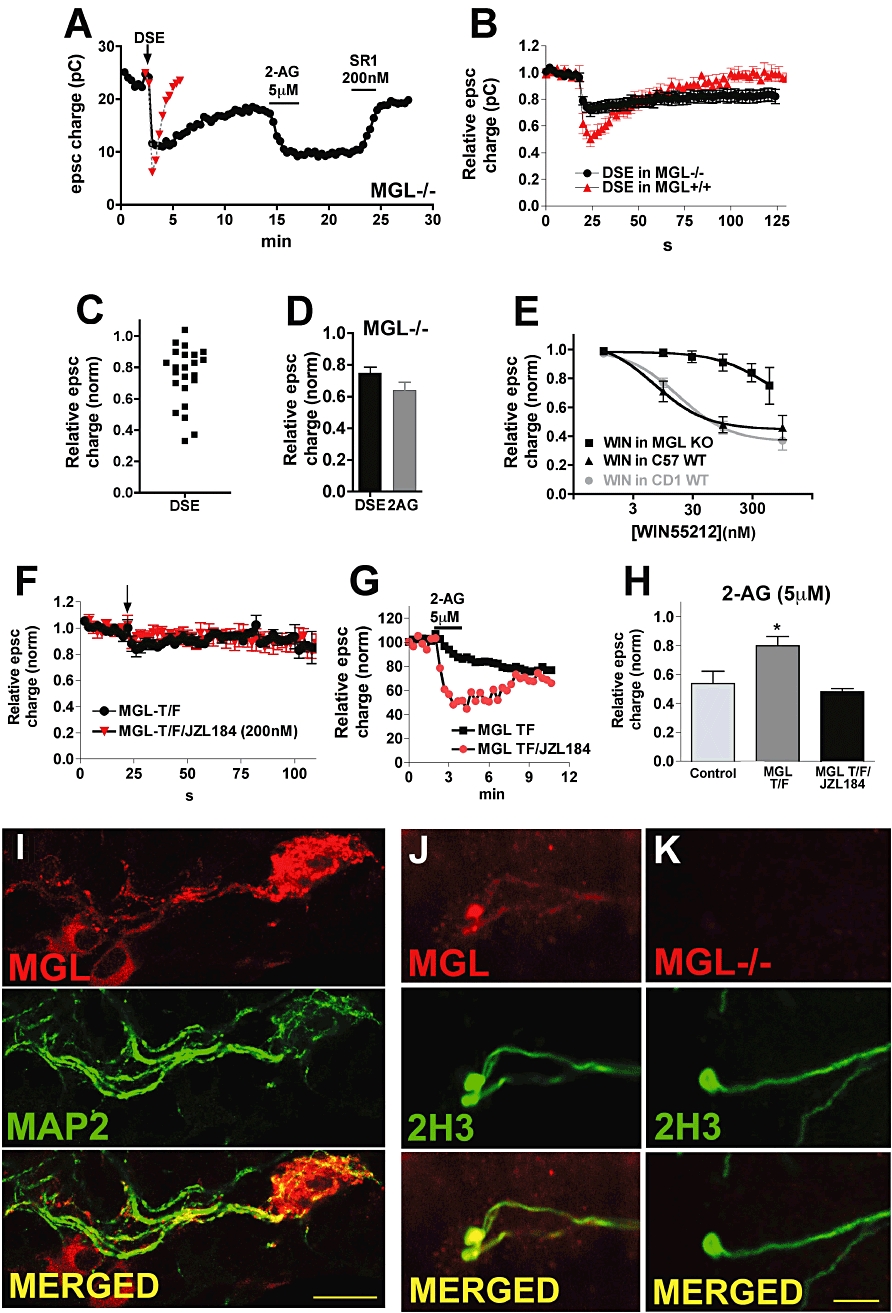
Background and purpose: Depolarization-induced suppression of inhibition (DSI) and excitation (DSE) are two forms of cannabinoid CB(1) receptor-mediated inhibition of synaptic transmission, whose durations are regulated by endocannabinoid (eCB) degradation. We have recently shown that in cultured hippocampal neurons monoacylglycerol lipase (MGL) controls the duration of DSE, while DSI duration is determined by both MGL and COX-2. This latter result suggests that DSE might be attenuated, and excitatory transmission enhanced, during inflammation and in other settings where COX-2 expression is up-regulated.
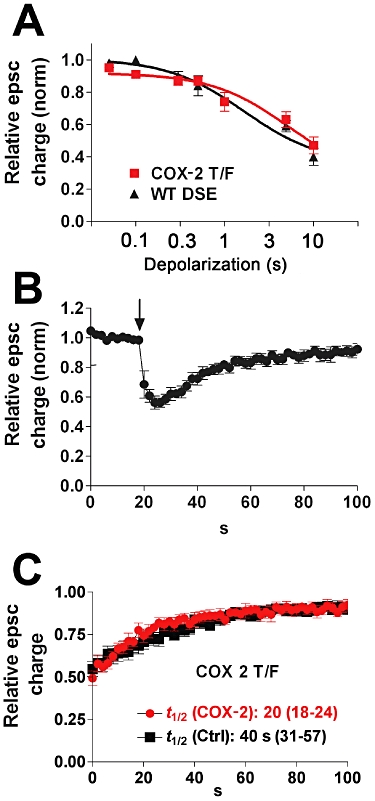
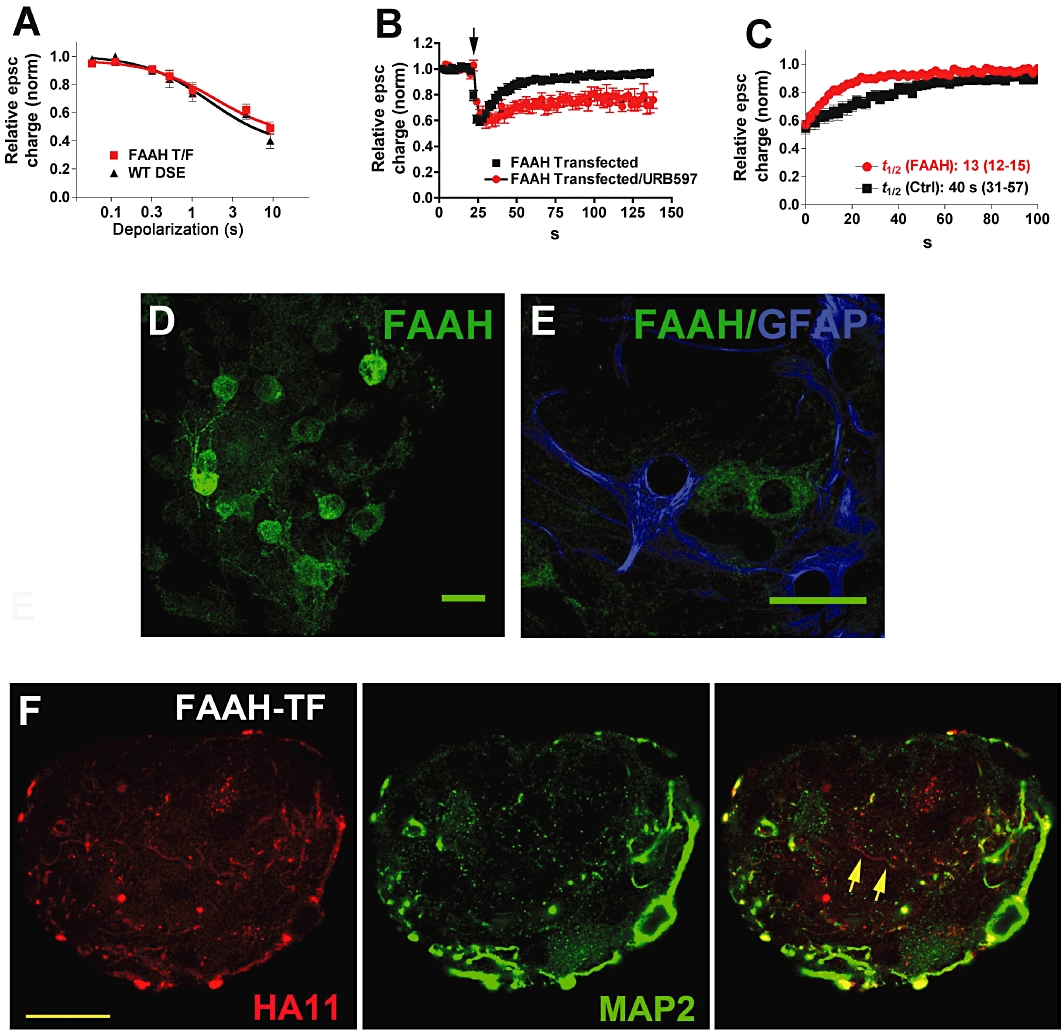
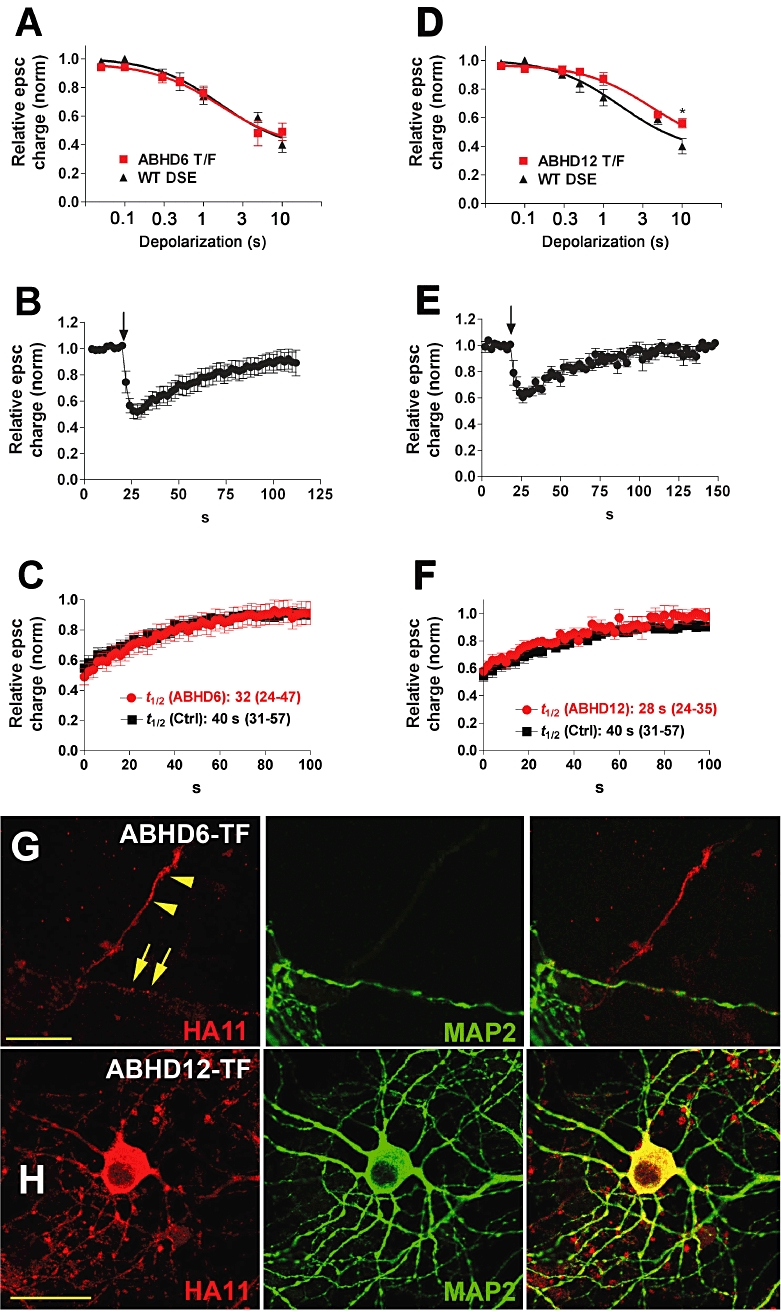
Experimental approach: To investigate whether it is possible to control the duration of eCB-mediated synaptic plasticity by varied expression of eCB-degrading enzymes, we transfected excitatory autaptic hippocampal neurons with putative 2-AG metabolizing enzymes: COX-2, fatty acid amide hydrolase (FAAH), α/β hydrolase domain 6 (ABHD6), α/β hydrolase domain 12 (ABHD12) or MGL.
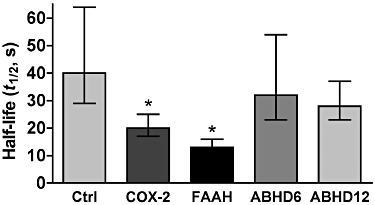
Key results: We found that overexpression of either COX-2 or FAAH shortens the duration of DSE while ABHD6 or ABHD12 do not. In contrast, genetic deletion (MGL(-/-)) and overexpression of MGL both radically altered eCB-mediated synaptic plasticity.
Conclusions and implications: We conclude that both FAAH and COX-2 can be trafficked to neuronal sites where they are able to degrade eCBs to modulate DSE duration and, by extension, net endocannabinoid signalling at a given synapse. The results for COX-2, which is often up-regulated under pathological conditions, are of particular note in that they offer a mechanism by which up-regulated COX-2 may promote neuronal excitation by suppressing DSE while enhancing conversion of 2-AG to PGE(2) -glycerol ester under pathological conditions.
© 2011 The Authors. British Journal of Pharmacology © 2011 The British Pharmacological Society.
Figures
Similar articles
-
Cannabinoid signaling in inhibitory autaptic hippocampal neurons.Neuroscience. 2009 Sep 29;163(1):190-201. doi: 10.1016/j.neuroscience.2009.06.004. Epub 2009 Jun 6. Neuroscience. 2009. PMID: 19501632 Free PMC article.
-
Monoacylglycerol lipase limits the duration of endocannabinoid-mediated depolarization-induced suppression of excitation in autaptic hippocampal neurons.Mol Pharmacol. 2009 Dec;76(6):1220-7. doi: 10.1124/mol.109.059030. Epub 2009 Sep 18. Mol Pharmacol. 2009. PMID: 19767452 Free PMC article.
-
Blockade of 2-arachidonoylglycerol hydrolysis by selective monoacylglycerol lipase inhibitor 4-nitrophenyl 4-(dibenzo[d][1,3]dioxol-5-yl(hydroxy)methyl)piperidine-1-carboxylate (JZL184) Enhances retrograde endocannabinoid signaling.J Pharmacol Exp Ther. 2009 Nov;331(2):591-7. doi: 10.1124/jpet.109.158162. Epub 2009 Aug 7. J Pharmacol Exp Ther. 2009. PMID: 19666749 Free PMC article.
-
The serine hydrolases MAGL, ABHD6 and ABHD12 as guardians of 2-arachidonoylglycerol signalling through cannabinoid receptors.Acta Physiol (Oxf). 2012 Feb;204(2):267-76. doi: 10.1111/j.1748-1716.2011.02280.x. Epub 2011 Apr 22. Acta Physiol (Oxf). 2012. PMID: 21418147 Free PMC article. Review.
-
Beyond the Direct Activation of Cannabinoid Receptors: New Strategies to Modulate the Endocannabinoid System in CNS-Related Diseases.Recent Pat CNS Drug Discov. 2016;10(2):122-141. doi: 10.2174/1574889810999160603185126. Recent Pat CNS Drug Discov. 2016. PMID: 27630088 Review.
Cited by
-
ABHD6: Its Place in Endocannabinoid Signaling and Beyond.Trends Pharmacol Sci. 2019 Apr;40(4):267-277. doi: 10.1016/j.tips.2019.02.002. Epub 2019 Mar 7. Trends Pharmacol Sci. 2019. PMID: 30853109 Free PMC article. Review.
-
Parsing the players: 2-arachidonoylglycerol synthesis and degradation in the CNS.Br J Pharmacol. 2014 Mar;171(6):1379-91. doi: 10.1111/bph.12411. Br J Pharmacol. 2014. PMID: 24102242 Free PMC article. Review.
-
2-Arachidonoylglycerol Modulation of Anxiety and Stress Adaptation: From Grass Roots to Novel Therapeutics.Biol Psychiatry. 2020 Oct 1;88(7):520-530. doi: 10.1016/j.biopsych.2020.01.015. Epub 2020 Mar 17. Biol Psychiatry. 2020. PMID: 32197779 Free PMC article. Review.
-
Discovery of prostamide F2α and its role in inflammatory pain and dorsal horn nociceptive neuron hyperexcitability.PLoS One. 2012;7(2):e31111. doi: 10.1371/journal.pone.0031111. Epub 2012 Feb 21. PLoS One. 2012. PMID: 22363560 Free PMC article.
-
α/β-Hydrolase domain-containing 6 (ABHD6) negatively regulates the surface delivery and synaptic function of AMPA receptors.Proc Natl Acad Sci U S A. 2016 May 10;113(19):E2695-704. doi: 10.1073/pnas.1524589113. Epub 2016 Apr 25. Proc Natl Acad Sci U S A. 2016. PMID: 27114538 Free PMC article.
References
-
- Adams J, Collaco-Moraes Y, de Belleroche J. Cyclooxygenase-2 induction in cerebral cortex: an intracellular response to synaptic excitation. J Neurochem. 1996;66:6–13. - PubMed
Publication types
MeSH terms
Substances
Grants and funding
LinkOut - more resources
Full Text Sources
Research Materials
