. 2011 Apr;9(4):e1000614.
doi: 10.1371/journal.pbio.1000614. Epub 2011 Apr 26.

Molecular determinants and genetic modifiers of aggregation and toxicity for the ALS disease protein FUS/TLS

Affiliations

Molecular determinants and genetic modifiers of aggregation and toxicity for the ALS disease protein FUS/TLS

Zhihui Sun et al. PLoS Biol. 2011 Apr.

Abstract

TDP-43 and FUS are RNA-binding proteins that form cytoplasmic inclusions in some forms of amyotrophic lateral sclerosis (ALS) and frontotemporal lobar degeneration (FTLD). Moreover, mutations in TDP-43 and FUS are linked to ALS and FTLD. However, it is unknown whether TDP-43 and FUS aggregate and cause toxicity by similar mechanisms. Here, we exploit a yeast model and purified FUS to elucidate mechanisms of FUS aggregation and toxicity. Like TDP-43, FUS must aggregate in the cytoplasm and bind RNA to confer toxicity in yeast. These cytoplasmic FUS aggregates partition to stress granule compartments just as they do in ALS patients. Importantly, in isolation, FUS spontaneously forms pore-like oligomers and filamentous structures reminiscent of FUS inclusions in ALS patients. FUS aggregation and toxicity requires a prion-like domain, but unlike TDP-43, additional determinants within a RGG domain are critical for FUS aggregation and toxicity. In further distinction to TDP-43, ALS-linked FUS mutations do not promote aggregation. Finally, genome-wide screens uncovered stress granule assembly and RNA metabolism genes that modify FUS toxicity but not TDP-43 toxicity. Our findings suggest that TDP-43 and FUS, though similar RNA-binding proteins, aggregate and confer disease phenotypes via distinct mechanisms. These differences will likely have important therapeutic implications.


Conflict of interest statement

The authors have declared that no competing interests exist.

Figures
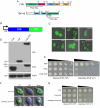
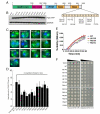
Figure 1
Figure 1. Yeast FUS model.
(A) Schematic of domain architecture of FUS and TDP-43. Note that both contain glycine-rich regions, RRM, and prion-like domains. In addition, FUS has two RGG domains. (B) Schematic of galactose-inducible construct to express human FUS fused to YFP. (C) Yeast cells expressing YFP alone or YFP-tagged human RNA-binding proteins. Not all RNA-binding proteins aggregate when expressed in yeast. For example, three related human RRM-containing proteins did not form inclusions when expressed in yeast. Instead they were diffusely localized: PPIE localized to the nucleus and cytoplasm; DND1 localized to the cytoplasm; and DNAJC17 was restricted to the nucleus. The ALS disease proteins, TDP-43 and FUS, formed multiple cytoplasmic foci when expressed in yeast. (D) Immunoblot showing untagged and YFP-tagged FUS expression. (E) FUS is toxic when expressed in yeast cells compared to YFP alone control. 5-fold serial dilutions of yeast cells expressing YFP alone, untagged FUS, or YFP-tagged FUS. Because of the galactose-inducible promoter, FUS expression is repressed when cells are grown in the presence of glucose (left panel, FUS expression “off”) and induced when grown in the presence of galactose (right panel, FUS expression “on”). (F) Fusing the strong heterologous SV40 NLS to the N-terminus of FUS restricts it mostly to the nucleus. (G) Spotting assay shows that nuclear-localized SV40 FUS-YFP is less toxic than WT FUS.
Figure 2
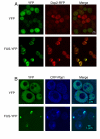
Figure 2. FUS associates with stress granules and P-bodies in yeast.
(A) Yeast cells expressing YFP alone (top row) or FUS-YFP (bottom row). Dcp2-RFP was used to monitor P-body formation and localization. FUS-YFP expression induced the formation of P-bodies and FUS-YFP cytoplasmic localized to these structures. (B) FUS also induced the formation of and localized to stress granules, as monitored by a CFP-fusion to the stress granule protein Pbp1. Similar results were observed with independent P-body and stress granule markers, Lsm1 and Pub1, respectively (unpublished data).
Figure 3
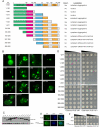
Figure 3. Defining the sequence features contributing to FUS aggregation and toxicity in yeast.
(A) A diagram illustrating the domain structure of FUS along with truncation constructs used in this study. (B) Testing the effects of truncations on FUS localization by fluorescence microscopy. The C-terminal domain is required for cytoplasmic localization and aggregation (compare constructs 1–373 and 1–526). Arrows point to larger cytoplasmic FUS inclusions and arrowheads point to cells with more diffuse cytoplasmic FUS with small foci (see table in panel A). (C) Immunoblot showing expression levels of full-length FUS and each truncation. (D) The effects of truncations on toxicity were assessed by spotting assays. As for aggregation, the C-terminal region is required for toxicity but by itself is not sufficient (construct 368–526). The RRM, glycine-rich region and most of the prion-like domain (see [33]) are also required for FUS toxicity (compare constructs 1–501, 50–526, and 100–526). RRM, RNA recognition motif. (E) Mutating conserved phenylalanine residues in the FUS RRM to leucine to abolish RNA binding (FUSRRM mutant) does not affect FUS aggregation in yeast, however RNA binding is important for FUS toxicity because the FUSRRM mutant eliminates toxicity in yeast (F).
Figure 4
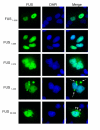
Figure 4. FUS domains that contribute to aggregation in mammalian cells.
V5-tagged FUS expression constructs were transfected into COS-7 cells and their localization determined by fluorescence microscopy. Full-length FUS (1–526) localized to the nucleus, consistent with previous reports ,,,. Deletion constructs 1–269 and 1–373 also localized to the nucleus, consistent with our results in yeast (see Figure 2). Also as in yeast, the addition of sequences in the first FUS RGG domain resulted in FUS aggregation in the cytoplasm (construct 1–422, arrows). Construct 50–526 also aggregated in the cytoplasm, however the morphology of the inclusions (arrowheads) was distinct from that of 1–422.
Figure 5
Figure 5. FUS is intrinsically aggregation prone.
(A) RNA mobility shift experiments. 32P-labelled FUS RNA probe (see Materials and Methods) was incubated in the presence or absence of increasing amounts of GST-FUS or GST and resolved on a native gel to observe free and bound RNA species. (B) Schematic of FUS aggregation assay. TEV protease is added to remove the GST tag and untagged FUS aggregation kinetics are followed over 90 min. (C) GST-FUS or GST (2.5–5 µM) was incubated in the presence or absence of TEV protease at 22°C for 0–90 min. Turbidity measurements were taken every minute to assess the extent of aggregation. Values represent means (n = 3). (D) GST-FUS (5 µM) was incubated in the presence or absence of TEV protease at 22°C for 0–60 min. At the indicated times, reactions were processed for sedimentation analysis. Pellet and supernatant fractions were resolved by SDS-PAGE and stained with Coomassie Brilliant Blue. A representative gel is shown. Note that cleaved FUS partitions mostly to the pellet fraction, whereas GST-FUS remains in the supernatant (SN) fraction. The amount of GST-FUS or FUS in the pellet fraction was determined by densitometry in comparison to known quantities of GST-FUS or FUS. Values represent means ± SEM (n = 4). (E) FUS (5 µM) was aggregated as in (C) for 60 min and processed for Thioflavin-T (ThT) fluorescence and compared to the ThT fluorescence of assembled Sup35-NM fibers (5 µM monomer). Values represent means ± SEM (n = 3). (F) FUS (5 µM) was aggregated as in (C) for 60 min. The amount of SDS-resistant FUS was then determined and compared to the amount of SDS-resistant Sup35-NM in assembled Sup35-NM fibers (5 µM monomer). Values represent means ± SEM (n = 3).
Figure 6
Figure 6. FUS aggregates more rapidly than TDP-43 in vitro.
(A) GST-FUS or GST-TDP-43 (2.5 or 5 µM) was incubated in the presence of TEV protease at 22°C for 0–90 min. Turbidity measurements were taken every minute to assess the extent of aggregation. A dataset representative of three replicates is shown. (B) GST-FUS or GST-TDP-43 (2.5 or 5 µM) was incubated in the presence of TEV protease at 22°C with agitation (700 rpm) for 0–90 min. The extent of aggregation was determined by turbidity. A dataset representative of three replicates is shown.
Figure 7
Figure 7. Defining the domain requirements for the aggregation of pure FUS.
(A) GST-FUS, GST-FUS 267–526, GST-FUS 1–373 (2.5 µM or 5 µM), or GST-FUS 1–422 (2.5 µM, 5 µM, or 20 µM) were incubated in the presence of TEV protease at 22°C for 0–90 min. Turbidity measurements were taken every minute to assess the extent of aggregation. A dataset representative of three replicates is shown. (B) GST-FUS, GST-FUS 267–526, GST-FUS 1–373, or GST-FUS 1–422 (5 µM) were incubated in the presence or absence of TEV protease at 22°C for 0–60 min. At the indicated times, reactions were processed for sedimentation analysis. Pellet and supernatant fractions were resolved by SDS-PAGE and stained with Coomassie Brilliant Blue. The amount of GST-FUS or FUS in the pellet fraction was determined by densitometry in comparison to known quantities of GST-FUS or FUS. Values represent means ± SEM (n = 3).
Figure 8
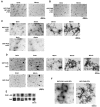
Figure 8. Pure FUS aggregates resemble FUS aggregates in degenerating motor neurons of ALS patients.
(A, B) GST-FUS 267–526 (2.5 µM) (A) or GST-FUS 1–373 (2.5 µM) (B) were incubated in the presence of TEV protease at 22°C for 0 or 60 min and processed for EM. Bar, 500 nm. (C) GST-FUS 1–422 (2.5 µM) was incubated in the absence or presence of TEV protease at 22°C for 0–60 min. At the indicated times, reactions were processed for EM. In the absence of TEV protease, very little aggregation occurs. In the presence of TEV protease, pore-shaped oligomers (arrows) and filamentous polymers (arrowheads) rapidly assemble. At 60 min, the filamentous structures stay well separated but are sometimes associated with smaller FUS 1–422 oligomers. Bar, 500 nm. (D) GST-FUS (2.5 µM) was incubated in the absence or presence of TEV protease at 22°C for 0–60 min. At the indicated times, reactions were processed for EM. In the absence of TEV protease, very little aggregation occurs. In the presence of TEV protease, pore-shaped oligomers (arrows) and filamentous polymers (arrowheads) rapidly assemble. The filamentous structures often form higher order network structures by 30 and 60 min. (E) Gallery of pore-shaped FUS 1–422 oligomers formed after 30 min and pore-shaped FUS oligomers formed after 10 min. Bar, 50 nm. (F) Lower magnification view of filamentous FUS 1–422 and FUS aggregates formed after 60 min in the presence of TEV protease. Note that FUS aggregates accumulate as larger networks that conglomerate into large aggregates, whereas FUS 1–422 filaments remain well separated. This difference in morphology likely explains why FUS aggregates generate a larger turbidity signal than FUS 1–422 aggregates. Bar, 500 nm.
Figure 9
Figure 9. The effect of ALS-linked FUS mutations on aggregation and toxicity.
(A) Diagram indicating disease-associated FUS mutations tested in this study. (B) Immunoblot showing equivalent expression levels of WT or mutant FUS. Glyceraldehyde-3-phosphate dehydrogenase (GAPDH) was used as a loading control. (C) ALS-linked mutations did not significantly affect FUS aggregation in yeast. (D) The effect of ALS-linked FUS mutations on aggregation in yeast cells was quantified by counting the number of cells containing >3 FUS-YFP foci (as in for TDP-43). Values represent means ± SEM (n≥3, at least 200 cells per sample). As for FUS toxicity, these ALS-linked mutations did not significantly enhance FUS aggregation, in contrast to TDP-43 mutations, which did increase aggregation . (E) GST-FUS, GST-FUS H517Q, GST-FUS R521H, or GST-FUS R521C (2.5 µM) was incubated in the presence of TEV protease at 22°C for 0–90 min. Turbidity measurements were taken every minute to assess the extent of aggregation. A dataset representative of three replicates is shown. (F) Spotting assay to compare the toxicity of WT and mutant FUS. Serial dilutions of yeast cells transformed with galactose-inducible empty vector, WT, or mutant FUS-YFP constructs. Transformants were spotted on glucose (non-inducing) or galactose (inducing) containing agar plates, and growth was assessed after 3 d. In contrast to TDP-43 , the ALS-linked FUS mutations did not enhance FUS toxicity in yeast.
Figure 10
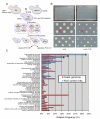
Figure 10. Yeast plasmid overexpression screen identifies suppressors and enhancers of FUS toxicity.
(A) Schematic of yeast genetic screen. Yeast cells harboring an integrated galactose-inducible FUS-YFP cassette were individually transformed with a library of 5,500 yeast open reading frames (ORFs) and spotted onto galactose plates to induce expression of FUS and each gene from the library. (B) A representative plate from the yeast screen. Each spot represents a yeast strain expressing FUS along with one gene from the library. Examples of genes that suppressed FUS toxicity (improved growth) are indicated by green arrows and enhancers of toxicity (inhibited growth) are indicated by red arrows. (C) A histogram indicating the functional categories of genes enriched as hits in the screen compared to the yeast genome. Genes involved in transcription and RNA metabolism were significantly overrepresented as hits in the screen (indicated by *). (D) Human homologs of two FUS toxicity modifier genes from the yeast screen, FBXW7 and EIF4A1, suppressed FUS toxicity in human cells (HEK293T), when co-transfected with FUS or ALS-linked FUS mutants, R521C and R521H. Cell viability was assessed by MTT assay. Values represent means ± S.D. (n = 3).
Figure 11
Figure 11. Yeast deletion screen identifies suppressors and enhancers of FUS toxicity.
(A) Schematic of yeast deletion screen, based on . The galactose-inducible FUS expression construct (pAG416Gal-FUS-YFP) was introduced into MATα strain Y7092 to generate the query strain. This query strain was mated to the yeast haploid deletion collection of non-essential genes (MATa, each gene deleted with KanMX cassette (confers resistance to G418)). Mating, sporulation, and mutant selection were performed using a Singer RoToR HDA (Singer Instruments, Somerset, UK). Haploid mutants harboring the FUS expression plasmid were grown in the presence of glucose (FUS expression “off”) or galactose (FUS expression “on”). Following growth at 30°C for 2 d, plates were photographed and colony sizes measured by ImageJ image analysis software, based on . (B) A representative plate from the deletion screen. Left is glucose (deletion alone, e.g. xxxΔ) and right is galactose (deletion + FUS expression, e.g. xxxΔ + FUS). Each plate contains 384 different strains pinned in duplicate (768 total). The red arrows point to an aggravating genetic interaction (toxicity enhancer), in which the gene deletion + FUS grows slower than FUS or the deletion alone. The green arrows point to an alleviating genetic interaction (toxicity suppressor), in which the gene deletion + FUS grows better than FUS or the deletion alone. (C) A histogram indicating the functional categories of genes enriched as hits in the screen compared to the yeast genome. Genes involved in RNA metabolism, ribosome biogenesis, and cellular stress responses were significantly overrepresented as hits in the screen (indicated by *).

Comment in

Similar articles

Cited by

References

    1. Rosen D, Siddique T, Patterson D, Figlewicz D, Sapp P, et al. Mutations in Cu/Zn superoxide dismutase gene are associated with familial amyotrophic lateral sclerosis. Nature. 1993;362:59–62. - PubMed
    1. Cleveland D. W, Rothstein J. D. From Charcot to Lou Gehrig: deciphering selective motor neuron death in ALS. Nat Rev Neurosci. 2001;2:806–819. - PubMed
    1. Neumann M, Sampathu D. M, Kwong L. K, Truax A. C, Micsenyi M. C, et al. Ubiquitinated TDP-43 in frontotemporal lobar degeneration and amyotrophic lateral sclerosis. Science. 2006;314:130–133. - PubMed
    1. Kwong L. K, Neumann M, Sampathu D. M, Lee V. M, Trojanowski J. Q. TDP-43 proteinopathy: the neuropathology underlying major forms of sporadic and familial frontotemporal lobar degeneration and motor neuron disease. Acta Neuropathol. 2007;114:63–70. - PubMed
    1. Chen-Plotkin A. S, Lee V. M, Trojanowski J. Q. TAR DNA-binding protein 43 in neurodegenerative disease. Nat Rev Neurol. 2010;6:211–220. - PMC - PubMed

Publication types

MeSH terms

Substances