. 2011 Jul;21(7):1109-21.
doi: 10.1101/gr.118992.110. Epub 2011 May 2.

Prioritizing candidate disease genes by network-based boosting of genome-wide association data

Affiliations

Prioritizing candidate disease genes by network-based boosting of genome-wide association data

Insuk Lee et al. Genome Res. 2011 Jul.

Abstract

Network "guilt by association" (GBA) is a proven approach for identifying novel disease genes based on the observation that similar mutational phenotypes arise from functionally related genes. In principle, this approach could account even for nonadditive genetic interactions, which underlie the synergistic combinations of mutations often linked to complex diseases. Here, we analyze a large-scale, human gene functional interaction network (dubbed HumanNet). We show that candidate disease genes can be effectively identified by GBA in cross-validated tests using label propagation algorithms related to Google's PageRank. However, GBA has been shown to work poorly in genome-wide association studies (GWAS), where many genes are somewhat implicated, but few are known with very high certainty. Here, we resolve this by explicitly modeling the uncertainty of the associations and incorporating the uncertainty for the seed set into the GBA framework. We observe a significant boost in the power to detect validated candidate genes for Crohn's disease and type 2 diabetes by comparing our predictions to results from follow-up meta-analyses, with incorporation of the network serving to highlight the JAK-STAT pathway and associated adaptors GRB2/SHC1 in Crohn's disease and BACH2 in type 2 diabetes. Consideration of the network during GWAS thus conveys some of the benefits of enrolling more participants in the GWAS study. More generally, we demonstrate that a functional network of human genes provides a valuable statistical framework for prioritizing candidate disease genes, both for candidate gene-based and GWAS-based studies.


Figures

Figure 1.
Figure 1.
Construction and evaluation of a genome-scale human gene network, HumanNet. (A) 21 diverse functional genomic and proteomic data sets (Supplemental Table S1) were evaluated for their tendencies to link genes in the same biological processes. Pairwise gene linkages derived from the individual data sets were then integrated into a composite network of higher accuracy and genome coverage than any individual data set. The integrated network (HumanNet) contains 476,399 functional linkages among 16,243 (86.7%) of the 18,714 genes encoding validated human proteins. The x-axis indicates the log-scale percentage of the 18,714 genes covered by functional linkages derived from the indicated data sets (curves); the y-axis indicates the predictive quality of the data sets, measured as the cumulative log likelihood of linked genes to share Gene Ontology (GO) biological process annotations, tested using 0.632 bootstrapping and plotted for successive bins of 1000 linkages each (symbols). Data sets are named as XX-YY, where XX indicates species of data origin (CE, C. elegans; DM, D. melanogaster; HS, H. sapiens; SC, S. cerevisiae) and YY indicates data type (CC, co-citation; CX, mRNA coexpression; DC, domain co-occurrence; GN, gene neighbor; GT, genetic interaction; LC, literature-curated protein interactions; MS, affinity purification/mass spectrometry; PG, phylogenetic profiles; PI, fly protein interactions; TS, tertiary structure; and YH, yeast two-hybrid). Detailed descriptions are listed in Supplemental Table S1. (B) Essential genes were highly interconnected in HumanNet, and thus predictable from the network, as shown by ROC analysis. Genes were ranked by their sum of network edge weights to the known essential genes, measuring recovery of known essential genes (true positives) and other genes (false positives) using leave-one-out cross-validation. (C) Genes involved in more specific cellular phenotypes—host factors required for HIV infection (HDF) (Brass et al. 2008), modulators of OCT4 (also known as POU5F1) expression (Oct4-GI) (Ding et al. 2009), and synthetic lethal partners of activated KRAS alleles (KRAS-SL) (Luo et al. 2009)—were also well predicted by their interconnectivity in HumanNet, calculated as for B. (D) Finally, network-linked gene pairs were substantially more likely to show similar tissue specificity in their expression patterns, measured as the likelihood of co-occurrence of transcripts of pairs of genes in the same tissues across 30 different human tissues from the TiGER database of tissue-specific gene expression and regulation (Liu et al. 2008).
Figure 2.
Figure 2.
Network-guided prediction of genes for transgenic mouse phenotypes and human diseases. (A) A schematic figure of network-guided prioritization of candidate disease genes. Given some known disease genes (black nodes), additional genes can be predicted by their (weighted) associations in the network, with more strongly connected genes being prioritized more highly (node shading). (B) Known genes associated with several human diseases are well predicted by the Iterative Ranking method for propagating disease labels across HumanNet, as measured using cross-validated ROC analysis. In this and later GBA analyses, we used leave-one-out cross-validation for phenotype sets of 3–10 genes and 10-fold cross-validation for all other sets. The performance can be summarized as the area under the ROC curve (AUC), ranging from 0.5 (random) to 1.0 (perfect). (C) Network GBA predictability of genes associated with 3374 transgenic mouse phenotypes. Bar-and-whiskers plots summarize the predictive performance (measured as cross-validated AUC) for each of six algorithms for using HumanNet to prioritize candidate disease genes. The Iterative Ranking and Gaussian smoothing approaches outperform the others by a significant margin, and show generally high predictability for more than three-quarters of the phenotypes tested. In bar-and-whiskers plots, the central horizontal line in the box indicates the median AUC, and the boundaries of the box indicate the first and third quartiles of the AUC distribution, whiskers indicate the 10th and 90th percentiles, and plus signs indicate individual outliers. The mean AUC is plotted as a dashed blue horizontal line. (D) A related analysis of human disease genes, assembled for 263 diseases from the OMIM database (http://omim.org/), shows similarly strong prediction strengths and the same relative ranking of algorithm performance.
Figure 3.
Figure 3.
The predictive power for loss-of-function phenotypes stems from a wide variety of data types integrated into HumanNet. Prediction both of (A) genes associated with mouse phenotypes and (B) of genes associated with human diseases are supported by diverse lines of evidence, including, for example, fly and worm data contributing strongly to mouse phenotypes, and yeast data contributing to human diseases. Grayscale indicates percentage contribution of a given data set's naive Bayes score to a phenotype's total AUC.
Figure 4.
Figure 4.
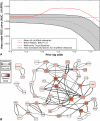
Consideration of the human gene network boosts recovery of validated Crohn's disease genes from GWAS analysis of 2000 cases and 3000 controls. (A) The performance improvement achieved by network-boosted GWAS relative to GWAS alone (Wellcome Trust Baseline, [Wellcome Trust Case Control Consortium 2007]), measuring performance as the area under a ROC curve up to 5% false positive rate (AUC, <5% FPR) for recovering the top 22 Crohn's disease genes identified in a larger meta-analysis of 4549 cases and 5579 controls (Barrett et al. 2008). For the AUC (<5% FPR) measure of performance, a perfect predictor achieves a score of 0.05, while random predictors score near 0.00125. The network boosted approach (colored red line) outperforms the GWAS alone (straight dashed blue line) over a wide range of parameter values. For comparison we also show the results of network boosting when randomized networks are used, plotting the mean (dotted line) and range of performance (2 SD) for 1000 random trials. B plots the network of candidate genes (rounded rectangles) identified from the combination of HumanNet and GWAS data, visualized using Cytoscape (Cline et al. 2007). The node size corresponds to the strength of the combined evidence from the Wellcome Trust Case Control Consortium (WTCCC) data and the network, and the intensity of the red color indicates how much the gene was boosted by the HumanNet GBA. HumanNet linkages are drawn as directed arrows connecting genes, with edge weight scaled by strength of boost contributed by the source to the sink. All genes are drawn with positive posterior log-odds when the prior log-odds of association are −1.7, except for network singletons, and the 50 highest scoring nonsingleton genes are shown. Note the strong boost given to GRB2 and SHC1, which are known to be involved in healing gastric ulcers (Pai et al. 1999), and to JAK2 and STAT3, which were also identified in later meta-analyses (Van Limbergen et al. 2009).
Figure 5.
Figure 5.
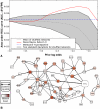
Consideration of the human gene network boosts recovery of validated type 2 diabetes genes from GWAS analysis of 2000 patients and 3000 controls. (A,B) Plotted using the same conventions as in Figure 4, analyzing WTCCC GWAS data (Wellcome Trust Case Control Consortium 2007) for type 2 diabetes alone and in combination with HumanNet and measuring performance as AUC (<5% FPR) for recovering the top 20 genes from a type 2 diabetes meta-analysis of 4549 cases and 5579 controls (Zeggini et al. 2008). As for Crohn's disease, consideration of the network boosts performance across a wide range of parameter values. Notably, consideration of the network strongly implicates the genes CTNNB1 and BACH2 in type 2 diabetes; CTNNB1 is well studied in connection with type 2 diabetes and BACH2 has been previously implicated in type 1 diabetes and celiac disease (e.g., Cooper et al. 2008; Madu et al. 2009), but not type 2 diabetes.

Similar articles

Cited by

References

    1. Akerblad P, Mansson R, Lagergren A, Westerlund S, Basta B, Lind U, Thelin A, Gisler R, Liberg D, Nelander S, et al. 2005. Gene expression analysis suggests that EBF-1 and PPARγ2 induce adipogenesis of NIH-3T3 cells with similar efficiency and kinetics. Physiol Genomics 23: 206–216 - PubMed
    1. Alexeyenko A, Sonnhammer EL 2009. Global networks of functional coupling in eukaryotes from comprehensive data integration. Genome Res 19: 1107–1116 - PMC - PubMed
    1. Altshuler D, Daly MJ, Lander ES 2008. Genetic mapping in human disease. Science 322: 881–888 - PMC - PubMed
    1. Baranzini SE, Galwey NW, Wang J, Khankhanian P, Lindberg R, Pelletier D, Wu W, Uitdehaag BM, Kappos L, Polman CH, et al. 2009. Pathway and network-based analysis of genome-wide association studies in multiple sclerosis. Hum Mol Genet 18: 2078–2090 - PMC - PubMed
    1. Barrett JC, Hansoul S, Nicolae DL, Cho JH, Duerr RH, Rioux JD, Brant SR, Silverberg MS, Taylor KD, Barmada MM, et al. 2008. Genome-wide association defines more than 30 distinct susceptibility loci for Crohn's disease. Nat Genet 40: 955–962 - PMC - PubMed

Publication types

MeSH terms

Substances