

Kinetics of the cell biological changes occurring in the progression of DNA damage-induced senescence
- PMID: 21533552
- PMCID: PMC3887620
- DOI: 10.1007/s10059-011-1032-4
Kinetics of the cell biological changes occurring in the progression of DNA damage-induced senescence
Abstract
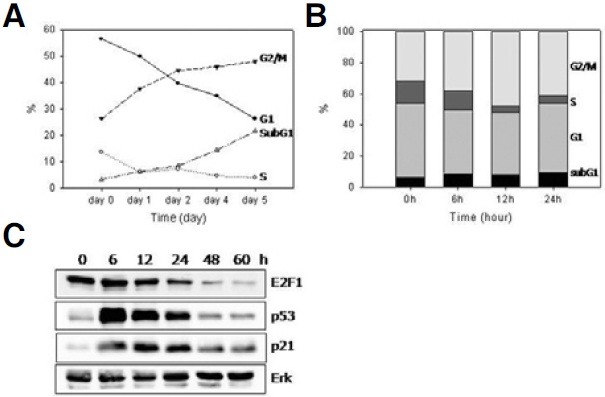
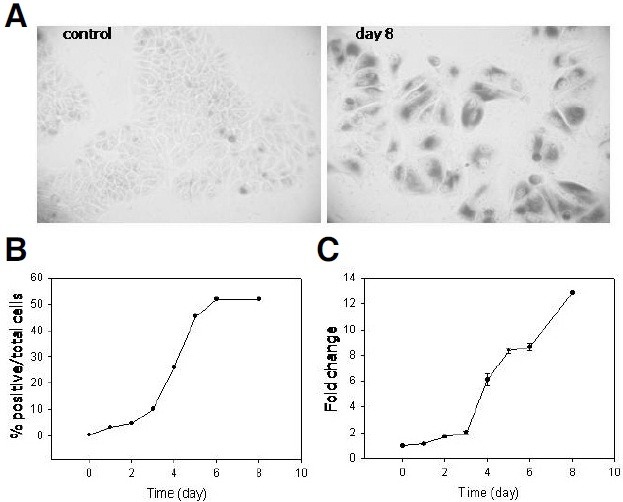
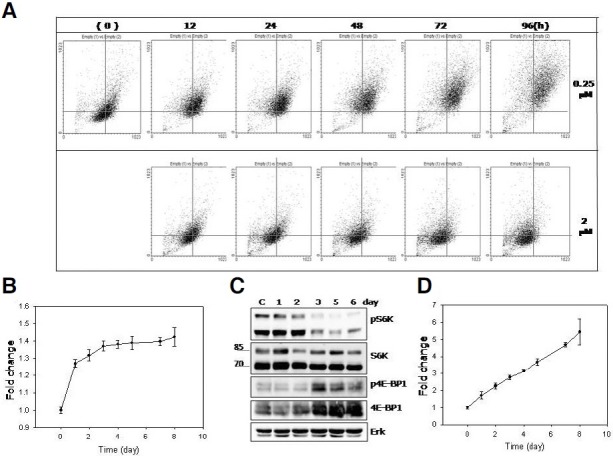
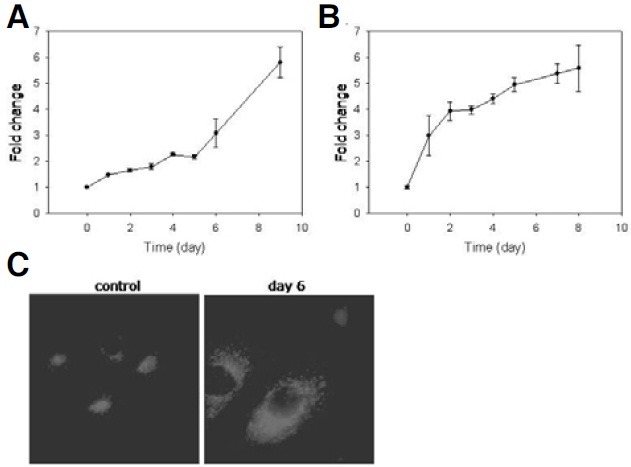
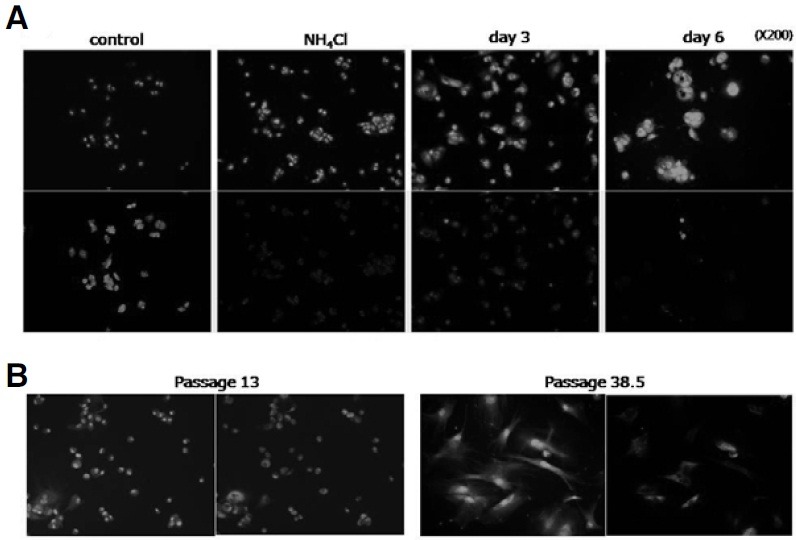
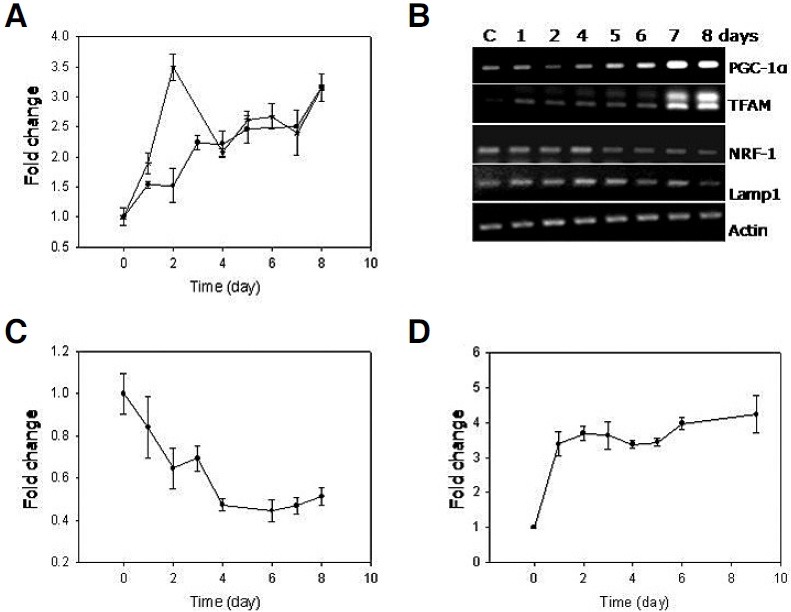
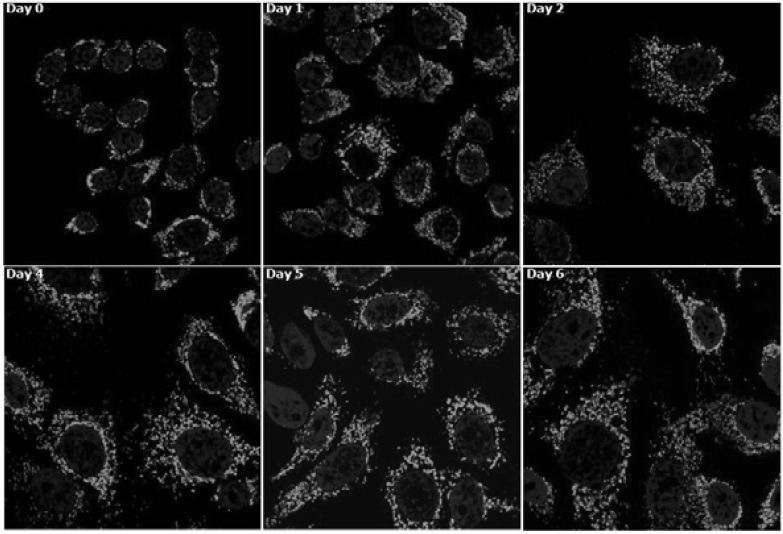
Cellular senescence is characterized by cell-cycle arrest accompanied by various cell biological changes. Although these changes have been heavily relied on as senescence markers in numerous studies on senescence and its intervention, their underlying mechanisms and relationship to each other are poorly understood. Furthermore, the depth and the reversibility of those changes have not been addressed previously. Using flow cytometry coupled with confocal microscopy and Western blotting, we quantified various senescence-associated cellular changes and determined their time course profiles in MCF-7 cells undergoing DNA damage-induced senescence. The examined properties changed with several different kinetics patterns. Autofluorescence, side scattering, and the mitochondria content increased progressively and linearly. Cell volume, lysosome content, and reactive oxygen species (ROS) level increased abruptly at an early stage. Meanwhile, senescence associated β-galactosidase activity increased after a lag of a few days. In addition, during the senescence progression, lysosomes exhibited a loss of integrity, which may have been associated with the accumulation of ROS. The finding that various senescence phenotypes matured at different rates with different lag times suggests multiple independent mechanisms controlling the expression of senescence phenotypes. This type of kinetics study would promote the understanding of how cells become fully senescent and facilitate the screening of methods that intervene in cellular senescence.
Figures
Similar articles
-
Fluorescence-based detection and quantification of features of cellular senescence.Methods Cell Biol. 2011;103:149-88. doi: 10.1016/B978-0-12-385493-3.00007-3. Methods Cell Biol. 2011. PMID: 21722803 Review.
-
Induction of ROS and DNA damage-dependent senescence by icaritin contributes to its antitumor activity in hepatocellular carcinoma cells.Pharm Biol. 2019 Dec;57(1):424-431. doi: 10.1080/13880209.2019.1628073. Pharm Biol. 2019. PMID: 31407933 Free PMC article.
-
Platycodin D Protects Human Fibroblast Cells from Premature Senescence Induced by H2O2 through Improving Mitochondrial Biogenesis.Pharmacology. 2020;105(9-10):598-608. doi: 10.1159/000505593. Epub 2020 Jan 31. Pharmacology. 2020. PMID: 32008007
-
Adjustment of the lysosomal-mitochondrial axis for control of cellular senescence.Ageing Res Rev. 2018 Nov;47:176-182. doi: 10.1016/j.arr.2018.08.003. Epub 2018 Aug 21. Ageing Res Rev. 2018. PMID: 30142381 Review.
-
Membrane damage by betulinic acid provides insights into cellular aging.Biochim Biophys Acta Gen Subj. 2017 Jan;1861(1 Pt A):3129-3143. doi: 10.1016/j.bbagen.2016.10.018. Epub 2016 Oct 20. Biochim Biophys Acta Gen Subj. 2017. PMID: 27773704
Cited by
-
Comparative Evaluation of Human Mesenchymal Stem Cells of Fetal (Wharton's Jelly) and Adult (Adipose Tissue) Origin during Prolonged In Vitro Expansion: Considerations for Cytotherapy.Stem Cells Int. 2013;2013:246134. doi: 10.1155/2013/246134. Epub 2013 Mar 3. Stem Cells Int. 2013. PMID: 23533440 Free PMC article.
-
Lipofuscin Granule Accumulation Requires Autophagy Activation.Mol Cells. 2023 Aug 31;46(8):486-495. doi: 10.14348/molcells.2023.0019. Epub 2023 Jul 13. Mol Cells. 2023. PMID: 37438887 Free PMC article.
-
Simple Detection Methods for Senescent Cells: Opportunities and Challenges.Front Aging. 2021 Jul 6;2:686382. doi: 10.3389/fragi.2021.686382. eCollection 2021. Front Aging. 2021. PMID: 35822046 Free PMC article. Review.
-
Status of mTOR activity may phenotypically differentiate senescence and quiescence.Mol Cells. 2012 Jun;33(6):597-604. doi: 10.1007/s10059-012-0042-1. Epub 2012 May 7. Mol Cells. 2012. PMID: 22570149 Free PMC article.
-
Synergistic apoptotic response between valproic acid and fludarabine in chronic lymphocytic leukaemia (CLL) cells involves the lysosomal protease cathepsin B.Blood Cancer J. 2013 Oct 18;3(10):e153. doi: 10.1038/bcj.2013.50. Blood Cancer J. 2013. PMID: 24141622 Free PMC article.
References
-
- Adams P.D. Healing and hurting: molecular mechanisms, functions, and pathologies of cellular senescence. Mol. Cell. (2009);36:2–14. - PubMed
-
- Berlin V., Haseltine W.A. Reduction of adriamycin to a semiquinone-free radical by NADPH cytochrome P-450 reductase produces DNA cleavage in a reaction mediated by molecular oxygen. J. Biol. Chem. (1981);256:4747–4756. - PubMed
-
- Blagosklonny M.V. Cell senescence: hypertrophic arrest beyond the restriction point. J. Cell Physiol. (2006);209:592–597. - PubMed
-
- Brunk U.T., Terman A. The mitochondrial-lysosomal axis theory of aging: accumulation of damaged mitochondria as a result of imperfect autophagocytosis. Eur. J. Biochem. (2002);269:1996–2002. - PubMed
-
- Brunk U.T., Jones C.B., Sohal R.S. A novel hypothesis of lipofuscinogenesis and cellular aging based on interactions between oxidative stress and autophagocytosis. Mutat. Res. (1992);275:395–403. - PubMed
Publication types
MeSH terms
Substances
LinkOut - more resources
Full Text Sources
