. 2011 Apr;9(4):e1001046.
doi: 10.1371/journal.pbio.1001046. Epub 2011 Apr 19.

A user's guide to the encyclopedia of DNA elements (ENCODE)

Collaborators, Affiliations

A user's guide to the encyclopedia of DNA elements (ENCODE)

ENCODE Project Consortium. PLoS Biol. 2011 Apr.

Abstract

The mission of the Encyclopedia of DNA Elements (ENCODE) Project is to enable the scientific and medical communities to interpret the human genome sequence and apply it to understand human biology and improve health. The ENCODE Consortium is integrating multiple technologies and approaches in a collective effort to discover and define the functional elements encoded in the human genome, including genes, transcripts, and transcriptional regulatory regions, together with their attendant chromatin states and DNA methylation patterns. In the process, standards to ensure high-quality data have been implemented, and novel algorithms have been developed to facilitate analysis. Data and derived results are made available through a freely accessible database. Here we provide an overview of the project and the resources it is generating and illustrate the application of ENCODE data to interpret the human genome.


Conflict of interest statement

The authors have declared that no competing interests exist.

Figures
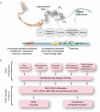
Figure 1
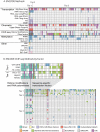
Figure 1. The Organization of the ENCODE Consortium.
(A) Schematic representation of the major methods that are being used to detect functional elements (gray boxes), represented on an idealized model of mammalian chromatin and a mammalian gene. (B) The overall data flow from the production groups after reproducibility assessment to the Data Coordinating Center (UCSC) for public access and to other public databases. Data analysis is performed by production groups for quality control and research, as well as at a cross-Consortium level for data integration.
Figure 2
Figure 2. Data available from the ENCODE Consortium.
(A) A data matrix representing all ENCODE data types. Each row is a method and each column is a cell line on which the method could be applied to generate data. Colored cells indicate that data have been generated for that method on that cell line. The different colors represent data generated from different groups in the Consortium as indicated by the key at the bottom of the figure. In some cases, more than one group has generated equivalent data; these cases are indicated by subdivision of the cell to accommodate multiple colors. (B) Data generated by ChIP-seq are split into a second matrix where the cells now represent cell types (rows) split by the factor or histone modification to which the antibody is raised (columns). The colors again represent the groups as indicated by the key. The upper left corner of this matrix has been expanded immediately above the panel to better illustrate the data. All data were collected from the ENCODE public download repository at http://hgdownload.cse.ucsc.edu/goldenPath/hg18/encodeDCC on September 1, 2010.
Figure 3
Figure 3. ENCODE gene and transcript annotations.
The image shows selected ENCODE and other gene and transcript annotations in the region of the human TP53 gene (region chr17:7,560,001–7,610,000 from the Human February 2009 (GRCh37/hg19) genome assembly). The annotated isoforms of TP53 RNAs listed from the ENCODE Gene Annotations (GENCODE) are shown in the top tracks of the figure, along with annotation of the neighboring WRAP53 gene. In black are two mRNA transcripts (U58658/AK097045) from GenBank. The bottom two tracks show the structure of the TP53 region transcripts detected in nuclear polyadenylated poly A+ RNAs isolated from GM12878 and K562 cells. The RNA is characterized by RNA-seq and the RNAs detected are displayed according to the strand of origin (i.e. + and −). Signals are scaled and are present at each of the detected p53 exons. Signals are also evident at the U58658 and AK097045 regions located in the first 10 kb intron of the p53 gene (D17S2179E). The U58658/AK097045 transcripts are reported to be induced during differentiation of myeloid leukemia cells but are seen in both GM12878 and K562 cell lines. Finally the p53 isoform observed in K562 cells has a longer 3′UTR region than the isoform seen in the GM12878 cell line.
Figure 4
Figure 4. ENCODE chromatin annotations in the HLA locus.
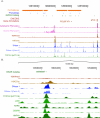
Chromatin features in a human lymphoblastoid cell line, GM12878, are displayed for a 114 kb region in the HLA locus. The top track shows the structures of the annotated isoforms of the HLA-DRB1, HLA-DQA1, and HLA-DQB1 genes from the ENCODE Gene Annotations (GENCODE), revealing complex patterns of alternative splicing and several non-protein-coding transcripts overlapping the protein-coding transcripts. The purple mark on the next line shows that a CpG in the promoter of the HLA-DQB1 gene is partially methylated (assayed on the Illumina Methylation27 BeadArray platform). The densities of four histone modifications associated with transcriptionally active loci are plotted next, along with the input control signal (generated by sequencing an aliquot of the sheared chromatin for which no immunoprecipitation was performed). The last lines plot the accessibility of DNA in chromatin to nucleases (DNaseI) and reduced coverage by nucleosomes (FAIRE); peaks on these lines are DNaseI hypersensitive sites. Note that the ENCODE Consortium generates DNaseI accessibility data by two alternative protocols marked by * and #. The magenta track shows DNaseI sensitivity in a different cell line, NHEK, for comparison.
Figure 5
Figure 5. Occupancy of transcription factors and RNA polymerase 2 on human chromosome 6p as determined by ChIP-seq.
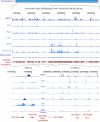
The upper portion shows the ChIP-seq signal of five sequence-specific transcription factors and RNA Pol2 throughout the 58.5 Mb of the short arm of human chromosome 6 of the human lymphoblastoid cell line GM12878. Input control signal is shown below the RNA Pol2 data. At this level of resolution, the sites of strongest signal appear as vertical spikes in blue next to the name of each experiment (“BATF,” “EBF,” etc.). More detail can be seen in the bottom right portion, where a 116 kb segment of the HLA region is expanded; here, individual sites of occupancy can be seen mapping to specific regions of the three HLA genes shown at the bottom, with asterisks indicating binding sites called by peak calling software. Finally, the lower left region shows a 3,500 bp region around two tandem histone genes, with RNA Pol2 occupancy at both promoters and two of the five transcription factors, BATF and cFos, occupying sites nearby. Selected annotations from the ENCODE Gene Annotations are shown in each case.
Figure 6
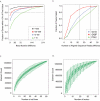
Figure 6. Incremental discovery of transcribed elements and regulatory DNA.
(A) Robustness of gene expression quantification relative to sequencing depth. PolyA-selected RNA from H1 human embryonic stem cells was sequenced to 214 million mapped reads. The number of reads (indicated on the x-axis) was sampled from the total, and gene expression (in FPKM) was calculated and compared to the gene expression values resulting from all the reads (final values). Gene expression levels were split into four abundance classes and the fraction of genes in each class with RPKM values within 10% of the final values was calculated. At ∼80 million mapped reads, more than 80% of the low abundance class of genes is robustly quantified according to this measure (horizontal dotted line). Abundances for the classes in RPKM are given in the inset box. (B) Effect of number of reads on fractions of peaks called in ChIP-seq. ChIP-seq experiments for three sequence-specific transcription factors were sequenced to a depth of 50 million aligned reads. To evaluate the effect of read depth on the number of binding sites identified, peaks were called with the MACS algorithm at various read depths, and the fraction of the total number of peaks that were identified at each read depth are shown. For sequence-specific transcription factors that have strong signal with ChIP-seq, such as GABP, approximately 24 million reads (dashed vertical line) are sufficient to capture 90% of the binding sites. However, for more general sequence-specific factors (e.g., OCT2), additional sequencing continues to yield additional binding site information. RNA Pol2, which interacts with DNA broadly across genes, maintains a nearly linear gain in binding information through 50 million aligned reads. (C) Saturation analysis of ENCODE DNaseI hypersensitivity data with increasing numbers of cell lines. The plot shows the extent of saturation of DNaseI hypersensitivity sites (DHSs) discovered as increasing numbers of cell lines are studied. The plot is generated from the ENCODE DNaseI elements defined at the end of January 2010 (from http://hgdownload.cse.ucsc.edu/goldenPath/hg18/encodeDCC) as follows. We first define a set of DHSs from the overlap of all DHS data across all cell lines. Where overlapping elements are identified in two or more cell lines, these are determined to represent the same element and fused up to a maximum size of 5 kb. Elements above this limit are split and counted as distinct. We then calculate the subset of these elements represented by each single cell line experiment. The distribution of element counts for each single cell line is plotted as a box plot with the median at position 1 on the x-axis. We next calculate the element contributions of all possible pairs of cell line experiments and plot this distribution at position 2. We continue to do this for all incremental steps up to and including all cell lines (which is by definition only a single data point). (D) Saturation of TF ChIP-seq elements in K562 cells. This plot illustrates the saturation of elements identified by TF ChIP-seq as additional factors are analyzed within the same cell line. The plot is generated by the equivalent approach as described in (C), except the data are now the set of all elements defined by ChIP-seq analysis of K562 cells with 42 different transcription factors. The data were from the January 2010 data freeze from http://hgdownload.cse.ucsc.edu/goldenPath/hg18/encodeDCC. For consistency, the peak calls from all ChIP-seq data were generated by a uniform processing pipeline with the Peakseq peak caller and IDR replicate reconciliation.
Figure 7
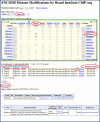
Figure 7. Accessing ENCODE data at the UCSC Portal.
Data and results for the ENCODE Project are accessible at the UCSC portal (http://genome.ucsc.edu/ENCODE). “Signal tracks” for the different datasets are selected and displayed in the genome browser to generate images such as those shown in Figures 3–4. The datasets are available from the Track Settings page; an example is shown that illustrates some of the key controls. A dataset is selected and the Signal display plots the values of an assay for a given feature more or less continuously along a chromosome. The height, range for the y-axis, windowing function, and many other aspects of the graph are controlled in the Signal Configuration window, accessed by clicking on “Signal” (red oval #1). ENCODE data are commonly generated on multiple cell lines; information about each can be accessed by clicking on the name of the cell line or antibody (e.g., HepG2, red oval #2). Many ENCODE tracks are actually composites of multiple subtracks; these can be turned on and off by using the boxes in the central matrix or in the subtrack list below. Subtracks can be reordered individually by using drag and drop in the browser image or the Track Settings page, or in logical groups by using the “Cell/Antibody/Views” (red oval #4) ordering controls. Additional information about the feature and the assay, such as the antibody used, can be obtained by clicking on the name of the feature. Some restrictions to the use of ENCODE data apply for a 9-month period after deposit of the data; the end of that 9-month period is given by the “Restricted Until” date. Full data can be downloaded by clicking on the “Downloads” link (red oval #7).
Figure 8
Figure 8. ENCODE data indicate non-coding regions in the human chromosome 8q24 loci associated with cancer.
(A) A 1 Mb region including MYC and a gene desert upstream shows the linkage disequilibrium blocks and positions of SNPs associated with breast and prostate cancer, with both a custom track based on and the resident track from the GWAS catalog. ENCODE tracks include GENCODE gene annotations, results of mapping RNAs to high-density Affymetrix tiling arrays (cytoplasmic and nuclear polyA+ RNA), mapping of histone modifications (H3K4me3 and H3K27Ac), DNaseI hypersensitive sites in liver and colon carcinoma cell lines (HepG2 and Caco-2), and occupancy by the transcription factor TCF7L2 in HCT116 cells. (B) Expanded view of a 9 kb region containing the cancer-associated SNP rs6983267 (shown on the top line). In addition to the histone modifications, DNaseI hypersensitive sites and factor occupancy described in (A), the ENCODE tracks also show occupancy by the coactivator p300 and the transcription factors RXRA, CEBPB, and HNF4A. Except as otherwise noted in brackets, the ENCODE data shown here are from the liver carcinoma cell line HepG2.

Similar articles

  • The ENCODE (ENCyclopedia Of DNA Elements) Project.
    ENCODE Project Consortium. ENCODE Project Consortium. Science. 2004 Oct 22;306(5696):636-40. doi: 10.1126/science.1105136. Science. 2004. PMID: 15499007
  • The ENCODE Portal as an Epigenomics Resource.
    Jou J, Gabdank I, Luo Y, Lin K, Sud P, Myers Z, Hilton JA, Kagda MS, Lam B, O'Neill E, Adenekan P, Graham K, Baymuradov UK, R Miyasato S, Strattan JS, Jolanki O, Lee JW, Litton C, Y Tanaka F, Hitz BC, Cherry JM. Jou J, et al. Curr Protoc Bioinformatics. 2019 Dec;68(1):e89. doi: 10.1002/cpbi.89. Curr Protoc Bioinformatics. 2019. PMID: 31751002 Free PMC article.
  • Expanded encyclopaedias of DNA elements in the human and mouse genomes.
    ENCODE Project Consortium; Moore JE, Purcaro MJ, Pratt HE, Epstein CB, Shoresh N, Adrian J, Kawli T, Davis CA, Dobin A, Kaul R, Halow J, Van Nostrand EL, Freese P, Gorkin DU, Shen Y, He Y, Mackiewicz M, Pauli-Behn F, Williams BA, Mortazavi A, Keller CA, Zhang XO, Elhajjajy SI, Huey J, Dickel DE, Snetkova V, Wei X, Wang X, Rivera-Mulia JC, Rozowsky J, Zhang J, Chhetri SB, Zhang J, Victorsen A, White KP, Visel A, Yeo GW, Burge CB, Lécuyer E, Gilbert DM, Dekker J, Rinn J, Mendenhall EM, Ecker JR, Kellis M, Klein RJ, Noble WS, Kundaje A, Guigó R, Farnham PJ, Cherry JM, Myers RM, Ren B, Graveley BR, Gerstein MB, Pennacchio LA, Snyder MP, Bernstein BE, Wold B, Hardison RC, Gingeras TR, Stamatoyannopoulos JA, Weng Z. ENCODE Project Consortium, et al. Nature. 2020 Jul;583(7818):699-710. doi: 10.1038/s41586-020-2493-4. Epub 2020 Jul 29. Nature. 2020. PMID: 32728249 Free PMC article.
  • A brief review on the Human Encyclopedia of DNA Elements (ENCODE) project.
    Qu H, Fang X. Qu H, et al. Genomics Proteomics Bioinformatics. 2013 Jun;11(3):135-41. doi: 10.1016/j.gpb.2013.05.001. Epub 2013 May 28. Genomics Proteomics Bioinformatics. 2013. PMID: 23722115 Free PMC article. Review.
  • Epigenetics, chromatin and genome organization: recent advances from the ENCODE project.
    Siggens L, Ekwall K. Siggens L, et al. J Intern Med. 2014 Sep;276(3):201-14. doi: 10.1111/joim.12231. Epub 2014 Mar 27. J Intern Med. 2014. PMID: 24605849 Review.

Cited by

References

    1. Collins F. S, Green E. D, Guttmacher A. E, Guyer M. S. A vision for the future of genomics research. Nature. 2003;422:835–847. - PubMed
    1. ENCODE Project Consortium. The ENCODE (ENCyclopedia Of DNA Elements) Project. Science. 2004;306:636–640. - PubMed
    1. ENCODE Project Consortium. Identification and analysis of functional elements in 1% of the human genome by the ENCODE pilot project. Nature. 2007;447:799–816. - PMC - PubMed
    1. Mouse Genome Sequencing Consortium. Initial sequencing and comparative analysis of the mouse genome. Nature. 2002;420:520–562. - PubMed
    1. Chiaromonte F, Weber R. J, Roskin K. M, Diekhans M, Kent W. J, Haussler D. The share of human genomic DNA under selection estimated from human-mouse genomic alignments. Cold Spring Harb Symp Quant Biol. 2003;68:245–254. - PubMed

Publication types