

Induction of ER stress in response to oxygen-glucose deprivation of cortical cultures involves the activation of the PERK and IRE-1 pathways and of caspase-12
- PMID: 21525936
- PMCID: PMC3122062
- DOI: 10.1038/cddis.2011.31
Induction of ER stress in response to oxygen-glucose deprivation of cortical cultures involves the activation of the PERK and IRE-1 pathways and of caspase-12
Abstract
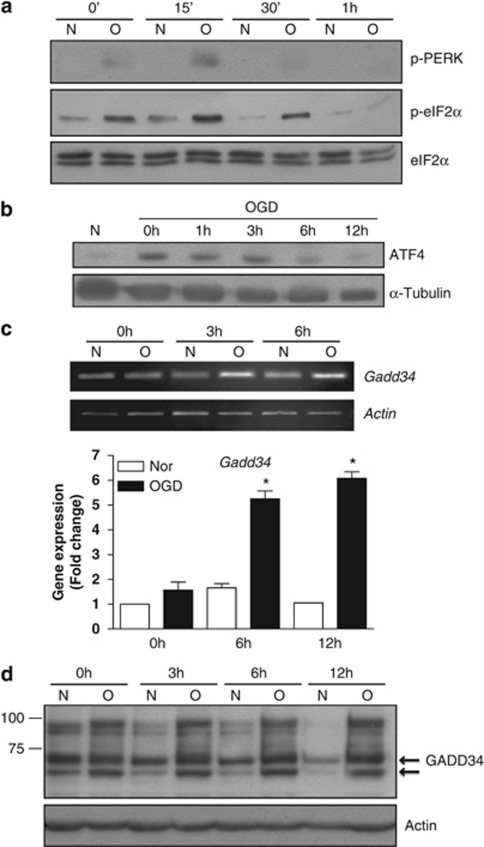
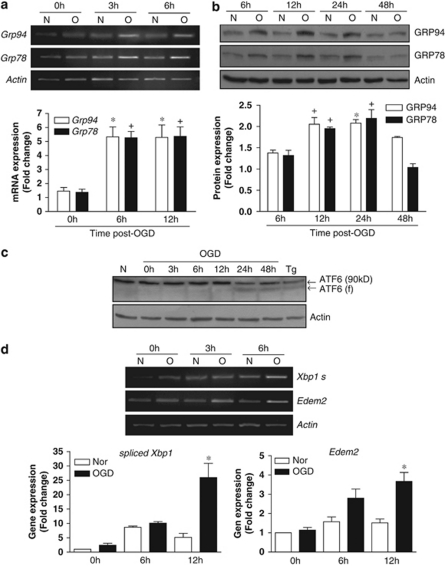
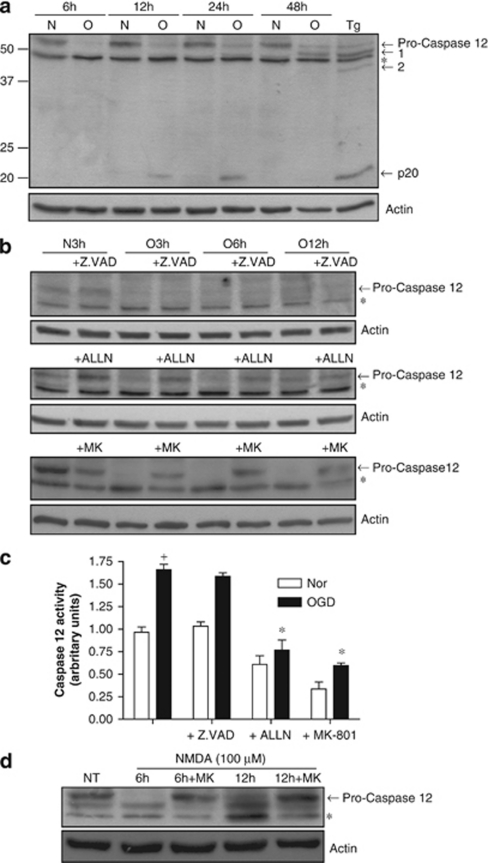
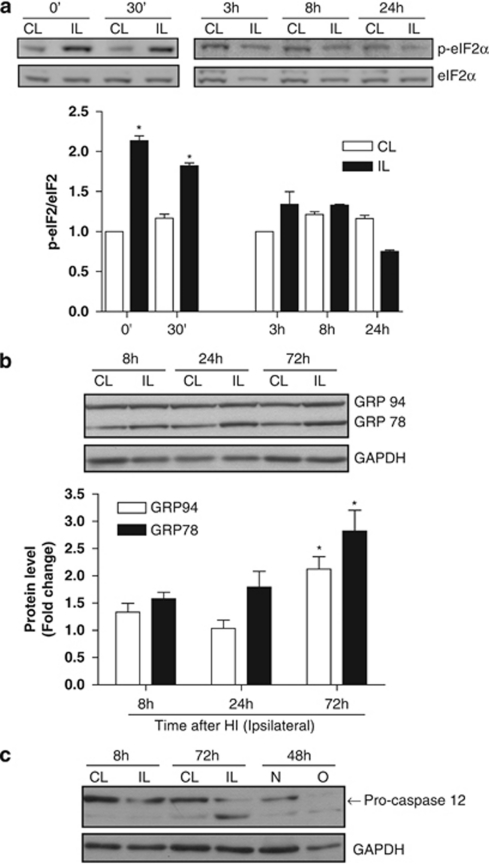
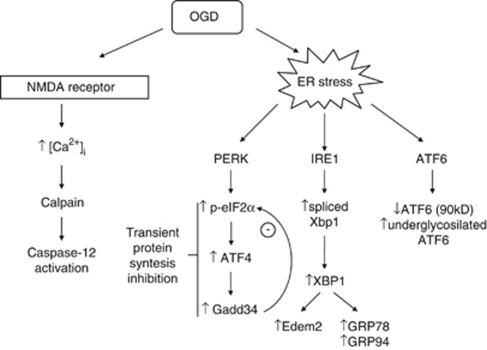
Disturbance of calcium homeostasis and accumulation of misfolded proteins in the endoplasmic reticulum (ER) are considered contributory components of cell death after ischemia. However, the signal-transducing events that are activated by ER stress after cerebral ischemia are incompletely understood. In this study, we show that caspase-12 and the PERK and IRE pathways are activated following oxygen-glucose deprivation (OGD) of mixed cortical cultures or neonatal hypoxia-ischemia (HI). Activation of PERK led to a transient phosphorylation of eIF2α, an increase in ATF4 levels and the induction of gadd34 (a subunit of an eIF2α-directed phosphatase). Interestingly, the upregulation of ATF4 did not lead to an increase in the levels of CHOP. Additionally, IRE1 activation was mediated by the increase in the processed form of xbp1, which would be responsible for the observed expression of edem2 and the increased levels of the chaperones GRP78 and GRP94. We were also able to detect caspase-12 proteolysis after HI or OGD. Processing of procaspase-12 was mediated by NMDA receptor and calpain activation. Moreover, our data suggest that caspase-12 activation is independent of the unfolded protein response activated by ER stress.
Figures
Similar articles
-
Endoplasmic reticulum stress as a correlate of cytotoxicity in human tumor cells exposed to diindolylmethane in vitro.Cell Stress Chaperones. 2004 Mar;9(1):76-87. doi: 10.1379/csc-2r.1. Cell Stress Chaperones. 2004. PMID: 15270080 Free PMC article.
-
Selective, potent blockade of the IRE1 and ATF6 pathways by 4-phenylbutyric acid analogues.Br J Pharmacol. 2013 Oct;170(4):822-34. doi: 10.1111/bph.12306. Br J Pharmacol. 2013. PMID: 23869584 Free PMC article.
-
Imaging of single cell responses to ER stress indicates that the relative dynamics of IRE1/XBP1 and PERK/ATF4 signalling rather than a switch between signalling branches determine cell survival.Cell Death Differ. 2015 Sep;22(9):1502-16. doi: 10.1038/cdd.2014.241. Epub 2015 Jan 30. Cell Death Differ. 2015. PMID: 25633195 Free PMC article.
-
The Role of the PERK/eIF2α/ATF4/CHOP Signaling Pathway in Tumor Progression During Endoplasmic Reticulum Stress.Curr Mol Med. 2016;16(6):533-44. doi: 10.2174/1566524016666160523143937. Curr Mol Med. 2016. PMID: 27211800 Free PMC article. Review.
-
Cellular stress/the unfolded protein response: relevance to sleep and sleep disorders.Sleep Med Rev. 2009 Jun;13(3):195-204. doi: 10.1016/j.smrv.2009.01.001. Epub 2009 Mar 28. Sleep Med Rev. 2009. PMID: 19329340 Free PMC article. Review.
Cited by
-
Global proteomic analysis of brain tissues in transient ischemia brain damage in rats.Int J Mol Sci. 2015 May 26;16(6):11873-91. doi: 10.3390/ijms160611873. Int J Mol Sci. 2015. PMID: 26016499 Free PMC article.
-
Psychiatric drugs bind to classical targets within early exocytotic pathways: therapeutic effects.Biol Psychiatry. 2012 Dec 1;72(11):907-15. doi: 10.1016/j.biopsych.2012.05.020. Epub 2012 Jul 6. Biol Psychiatry. 2012. PMID: 22771239 Free PMC article. Review.
-
EPHB4 inhibition activates ER stress to promote immunogenic cell death of prostate cancer cells.Cell Death Dis. 2019 Oct 22;10(11):801. doi: 10.1038/s41419-019-2042-y. Cell Death Dis. 2019. PMID: 31641103 Free PMC article.
-
Endoplasmic reticulum stress induced by tunicamycin and thapsigargin protects against transient ischemic brain injury: Involvement of PARK2-dependent mitophagy.Autophagy. 2014 Oct 1;10(10):1801-13. doi: 10.4161/auto.32136. Epub 2014 Aug 5. Autophagy. 2014. PMID: 25126734 Free PMC article.
-
Impacts of tissue-type plasminogen activator (tPA) on neuronal survival.Front Cell Neurosci. 2015 Oct 16;9:415. doi: 10.3389/fncel.2015.00415. eCollection 2015. Front Cell Neurosci. 2015. PMID: 26528141 Free PMC article. Review.
References
-
- Hara H, Fink K, Endres M, Friedlander RM, Gagliardini V, Moskowitz MA. Attenuation of transient focal cerebral ischemic injury in transgenic mice expressing a mutant ICE inhibitory protein. J Cereb Blood Flow Metab. 1997;17:370–375. - PubMed
-
- Malagelada C, XIfrò X, Min̋ano A, Sabrìa J, Rodriguez-Alvarez J. Contribution of caspase-mediated apoptosis to the cell death caused by oxygen-glucose deprivation in cortical cell cultures. Neurobiol Dis. 2005;20:27–37. - PubMed
-
- Rao RV, Ellerby HM, Bredesen DE. Coupling endoplasmic reticulum stress to the cell death program. Cell Death Differ. 2004;11:372–380. - PubMed
-
- Bertolotti A, Zhang Y, Hendershot LM, Harding HP, Ron D. Dynamic interaction of BiP and ER stress transducers in the unfolded-protein response. Nat Cell Biol. 2000;2:326–332. - PubMed
-
- Shen J, Chen X, Hendershot L, Prywes R. ER stress regulation of ATF6 localization by dissociation of BiP/GRP78 binding and unmasking of Golgi localization signals. Dev Cell. 2002;3:99–111. - PubMed
Publication types
MeSH terms
Substances
LinkOut - more resources
Full Text Sources
Molecular Biology Databases
Research Materials
Miscellaneous
