. 2011 Jun 23;117(25):6912-22.
doi: 10.1182/blood-2011-02-334359. Epub 2011 Apr 26.

DOT1L, the H3K79 methyltransferase, is required for MLL-AF9-mediated leukemogenesis

Affiliations

DOT1L, the H3K79 methyltransferase, is required for MLL-AF9-mediated leukemogenesis

Anh Tram Nguyen et al. Blood. .

Abstract

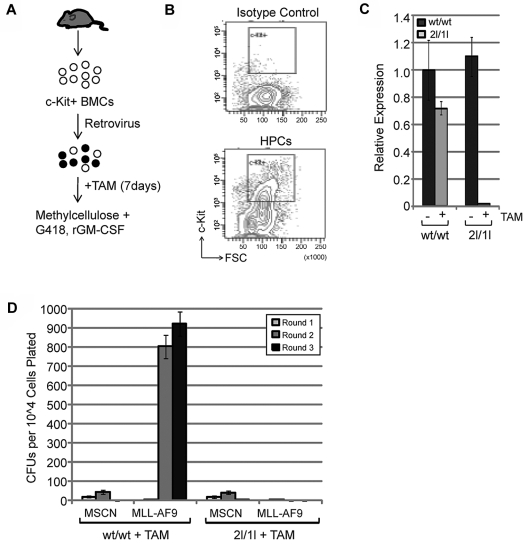
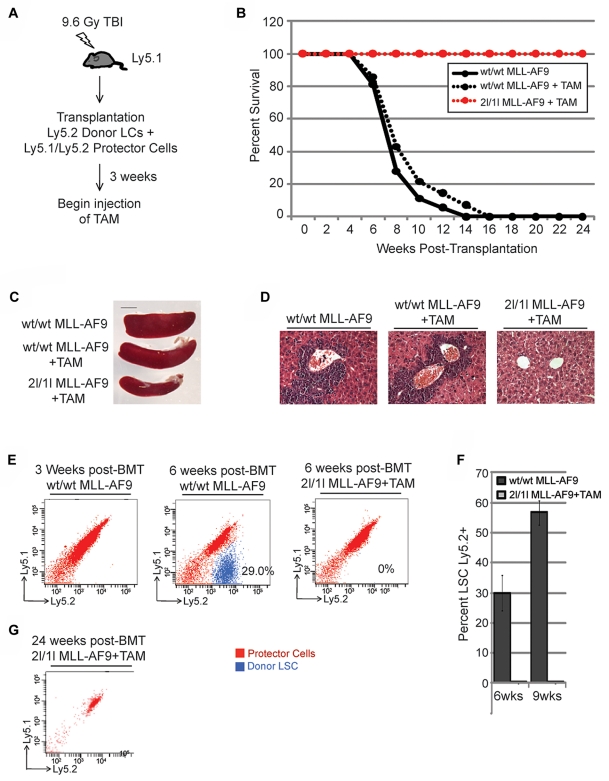
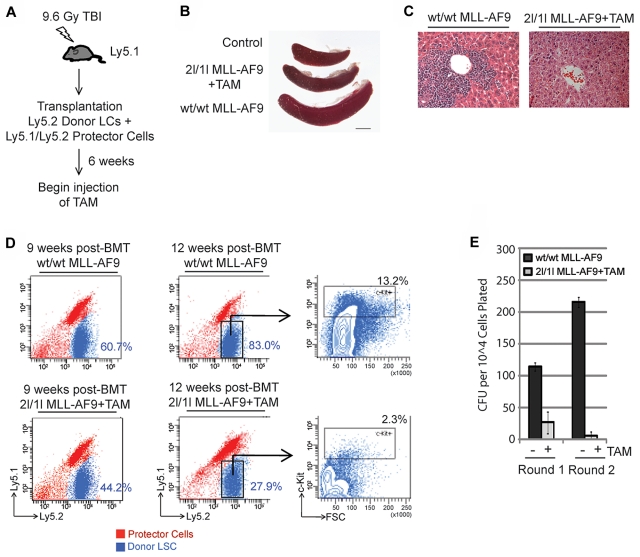
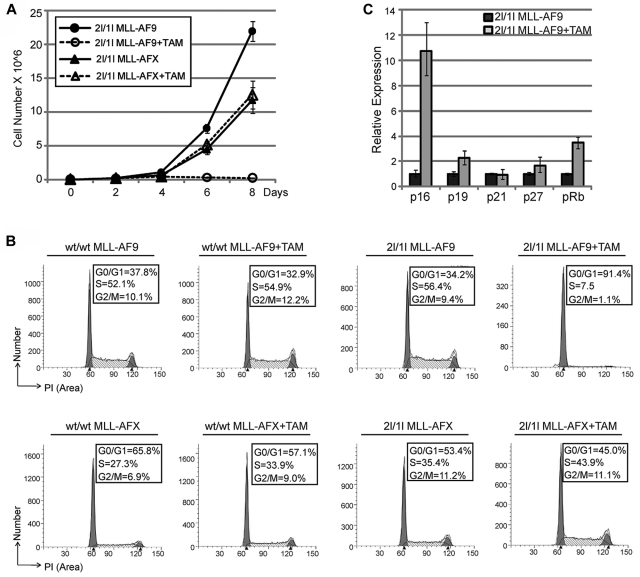
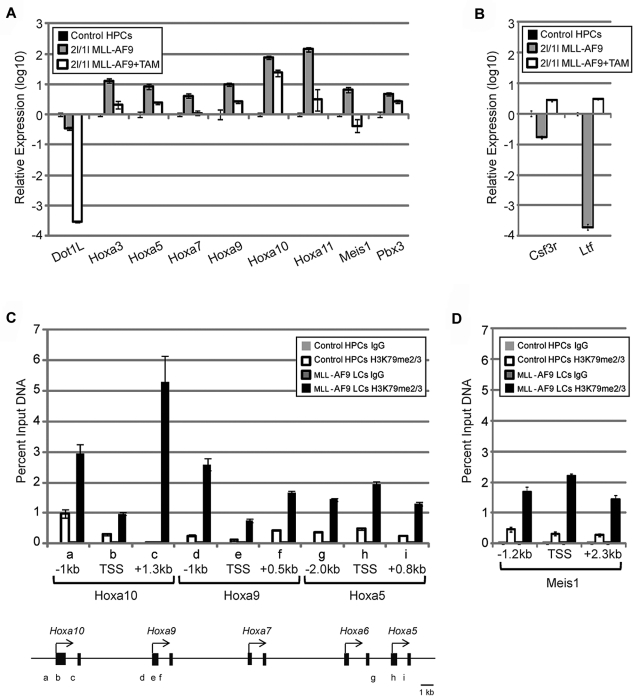
Chromosomal translocations of the mixed lineage leukemia (MLL) gene are a common cause of acute leukemias. The oncogenic function of MLL fusion proteins is, in part, mediated through aberrant activation of Hoxa genes and Meis1, among others. Here we demonstrate using a tamoxifen-inducible Cre-mediated loss of function mouse model that DOT1L, an H3K79 methyltransferase, is required for both initiation and maintenance of MLL-AF9-induced leukemogenesis in vitro and in vivo. Through gene expression and chromatin immunoprecipitation analysis we demonstrate that mistargeting of DOT1L, subsequent H3K79 methylation, and up-regulation of Hoxa and Meis1 genes underlie the molecular mechanism of how DOT1L contributes to MLL-AF9-mediated leukemogenesis. Our study not only provides the first in vivo evidence for the function of DOT1L in leukemia, but also reveals the molecular mechanism for DOT1L in MLL-AF9 mediated leukemia. Thus, DOT1L may serve as a potential therapeutic target for the treatment of leukemia caused by MLL translocations.


Figures

Figure 1
Figure 1
DOT1L is required for MLL-AF9-induced transformation in vitro. (A) Diagram of the procedure used for in vitro analysis. (B) Bone marrow cells were stained with rat IgG2a-APC isotype control to identify c-Kit-negative population or rat antimouse c-Kit-APC. c-Kit+ cells were sorted using a BD FACSAria II instrument. (C) RT-qPCR analysis of DOT1L expression level, normalized to Gapdh, after 7 days of TAM treatment (250nM final concentration) demonstrates efficient recombination. Mouse genotype is indicated. (D) Serial methylcellulose colony replating assay shows that MLL-AF9 fails to transform HPCs in the absence of DOT1L. An equal number of cells transduced with empty vector MSCN or MLL-AF9 were plated at each round and colony forming units (CFUs) counted after 7 to10 days. Experiment was performed 3 times and presented as average number of CFUs with standard deviation (SD).
Figure 2
Figure 2
DOT1L is required for MLL-AF9–mediated leukemogenesis in vivo. (A) Diagram of the BMT procedure to examine the effect of DOT1L depletion on the establishment of AML by MLL-AF9–transformed cells in vivo. TAM treatment began at 3 weeks after transplantation. (B-G) In vivo deletion of DOT1L prevents MLL-AF9–mediated acute leukemia development. (B) Kaplan-Meier plot showing survival of transplanted mice treated and untreated with TAM. Median survival of wt/wt MLL-AF9–transplanted mice without TAM = 7 weeks (n = 17) and wt/wt MLL-AF9 transplanted mice treated with TAM = 7 weeks (n = 14). All 2lox/1lox MLL-AF9–transplanted mice treated with TAM (n = 18) survive at least 24 weeks after transplantation. (C) Representative image of spleens harvested from transplanted mice at 6 weeks after transplantation show splenomegaly in wt/wt MLL-AF9 transplanted mice (n = 3 per group). (D) Representative H&E staining of liver tissue sections at 6 weeks after transplantation show leukemic infiltration in wt/wt MLL-AF9 transplanted mice (n = 3 per group). (E) Donor cells depleted of DOT1L are absent in recipient bone marrow. Representative images showing FACS analysis of bone marrow cells isolated from transplanted mice (n = 3 per group). Donor MLL-AF9 cells are Ly5.2+ (blue) while recipient/protector cells are Ly5.1+/Ly5.2+ (red). (F) Percentage of MLL-AF9 LCs present in recipient bone marrow at 6 and 9 weeks after transplantation as determined by FACS analysis (n = 3 per group). (G) No transformed donor cells are detected by FACS analysis of peripheral blood obtained from 2lox/1lox MLL-AF9+TAM mice at 24 weeks after transplantation. Representative image from 1 of 6 mice analyzed.
Figure 3
Figure 3
MLL-AF9 cells require DOT1L to maintain transformation in vitro. (A) Diagram of the procedure analyzing role of DOT1L in maintaining transformation in vitro. (B) Genotyping to verify efficient Cre-mediated recombination of DOT1L2lox conditional allele. (C) RT-qPCR analysis of DOT1L expression level in 2lox/1lox MLL-AF9 cells, normalized to Gapdh, after 7 days of TAM treatment (250nM final concentration) demonstrates efficient recombination. (D) DOT1L is required for maintaining MLL-AF9 transformation but not for MLL-AFX. Methylcellulose colony formation assay after TAM treatment of transformed cells. Equal number of cells were plated and average numbers of CFUs from 3 independent experiments are shown. Error bars represent SD.
Figure 4
Figure 4
DOT1L is required for MLL-AF9–induced acute leukemia progression in vivo. (A) Diagram of BMT procedure to examine the requirement of DOT1L in MLL-AF9 AML progression. TAM treatment began at 6 weeks after transplantation after leukemia development. (B-E) In vivo deletion of DOT1L prevents MLL-AF9 AML progression. (B) Reduced spleen size in TAM-treated 2lox/1lox MLL-AF9 recipient mice. Representative images of spleens harvested from transplanted mice at 9 weeks after transplantation (n = 3 per group). (C) TAM-induced DOT1L deletion prevents leukemic infiltration of the liver. Representative H&E staining of liver tissue sections at 9 weeks after transplantation (n = 3 per group). (D) On DOT1L depletion, the percentage of transformed donor cells in bone marrow diminishes over time. FACS analysis of bone marrow cells isolated from transplanted mice (n = 3 per group, per time point). Donor MLL-AF9 cells are Ly5.2+ (blue) and recipient/protector cells are Ly5.1+/Ly5.2+ (red). Percentage of donor Ly5.2 cells in the total bone marrow cell population at 9 and 12 weeks after transplantation are indicated. At 12 weeks after transplantation, cells were also stained with the stem cell/progenitor marker c-Kit. Transformed donor Ly5.2 population is gated and percentage of c-Kit+ cells indicated. Shown are representative images from 3 independent experiments. (E) Loss of clonogenic leukemic stem cells after in vivo DOT1L depletion. Methylcellulose colony formation assay of donor cells sorted from mice at 12 weeks after transplantation. Average CFUs are shown (n = 3). Error bars represent SD.
Figure 5
Figure 5
Loss of DOT1L inhibits cell proliferation because of a G0/G1 cell-cycle arrest. (A) In vitro TAM-induced DOT1L deletion inhibits proliferation of MLL-AF9–transformed cells in liquid culture but not MLL-AFX. Total cell numbers were counted every 2 days. Shown is the average of 3 independent experiments with error bars. (B) In vitro TAM-induced DOT1L deletion causes cell-cycle arrest at G0/G1 phase for MLL-AF9–transformed cells. Cell-cycle analysis was performed by PI staining. Experiment was repeated twice. Data were analyzed using ModFit software. (C) Gene-expression analysis by RT-qPCR shows up-regulation of CDK inhibitors after DOTL depletion, normalized to Gapdh.
Figure 6
Figure 6
DOT1L directly regulates expression of Hoxa and Meis1 genes in MLL-AF9–transformed cells. (A) RT-qPCR analysis shows up-regulation of Hoxa cluster and their cofactors Meis1 and Pbx3, normalized to Gapdh, in MLL-AF9–transformed cells, which become down-regulated on DOT1L deletion. (B) RT-qPCR analysis shows down-regulation of myeloid differentiation markers, normalized to Gapdh, in MLL-AF9–transformed cells, which become up-regulated on DOT1L deletion. (C) ChIP analysis demonstrates that H3K79me2/3 is specifically enriched at Hoxa loci in MLL-AF9–transformed cells compared with control HPCs. IgG was used for control ChIP and amplicon positions are indicated (TSS indicates transcription start site). (D) ChIP analysis demonstrates that H3K79me2/3 is enriched in the Meis1 gene in MLL-AF9 LCs compared with that in the control HPCs. IgG was used for control ChIP and amplicon positions are indicated (TSS indicates transcription start site).

Similar articles

Cited by

References

    1. Kouzarides T. Chromatin modifications and their function. Cell. 2007;128(4):693–705. - PubMed
    1. Martin C, Zhang Y. The diverse functions of histone lysine methylation. Nat Rev Mol Cell Biol. 2005;6(11):838–849. - PubMed
    1. Hsieh JJ, Cheng EH, Korsmeyer SJ. Taspase1: a threonine aspartase required for cleavage of MLL and proper HOX gene expression. Cell. 2003;115(3):293–303. - PubMed
    1. Hsieh JJ, Ernst P, Erdjument-Bromage H, Tempst P, Korsmeyer SJ. Proteolytic cleavage of MLL generates a complex of N- and C-terminal fragments that confers protein stability and subnuclear localization. Mol Cell Biol. 2003;23(1):186–194. - PMC - PubMed
    1. Ayton PM, Cleary ML. Molecular mechanisms of leukemogenesis mediated by MLL fusion proteins. Oncogene. 2001;20(40):5695–5707. - PubMed

Publication types

MeSH terms