Variance adjusted weighted UniFrac: a powerful beta diversity measure for comparing communities based on phylogeny
- PMID: 21518444
- PMCID: PMC3108311
- DOI: 10.1186/1471-2105-12-118
Variance adjusted weighted UniFrac: a powerful beta diversity measure for comparing communities based on phylogeny
Abstract
Background: Beta diversity, which involves the assessment of differences between communities, is an important problem in ecological studies. Many statistical methods have been developed to quantify beta diversity, and among them, UniFrac and weighted-UniFrac (W-UniFrac) are widely used. The W-UniFrac is a weighted sum of branch lengths in a phylogenetic tree of the sequences from the communities. However, W-UniFrac does not consider the variation of the weights under random sampling resulting in less power detecting the differences between communities.
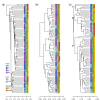
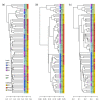
Results: We develop a new statistic termed variance adjusted weighted UniFrac (VAW-UniFrac) to compare two communities based on the phylogenetic relationships of the individuals. The VAW-UniFrac is used to test if the two communities are different. To test the power of VAW-UniFrac, we first ran a series of simulations which revealed that it always outperforms W-UniFrac, as well as UniFrac when the individuals are not uniformly distributed. Next, all three methods were applied to analyze three large 16S rRNA sequence collections, including human skin bacteria, mouse gut microbial communities, microbial communities from hypersaline soil and sediments, and a tropical forest census data. Both simulations and applications to real data show that VAW-UniFrac can satisfactorily measure differences between communities, considering not only the species composition but also abundance information.
Conclusions: VAW-UniFrac can recover biological insights that cannot be revealed by other beta diversity measures, and it provides a novel alternative for comparing communities.
Figures


Similar articles
-
Quantitative and qualitative beta diversity measures lead to different insights into factors that structure microbial communities.Appl Environ Microbiol. 2007 Mar;73(5):1576-85. doi: 10.1128/AEM.01996-06. Epub 2007 Jan 12. Appl Environ Microbiol. 2007. PMID: 17220268 Free PMC article.
-
UniFrac--an online tool for comparing microbial community diversity in a phylogenetic context.BMC Bioinformatics. 2006 Aug 7;7:371. doi: 10.1186/1471-2105-7-371. BMC Bioinformatics. 2006. PMID: 16893466 Free PMC article.
-
UniFrac: a new phylogenetic method for comparing microbial communities.Appl Environ Microbiol. 2005 Dec;71(12):8228-35. doi: 10.1128/AEM.71.12.8228-8235.2005. Appl Environ Microbiol. 2005. PMID: 16332807 Free PMC article.
-
Phylogenetic molecular ecological network of soil microbial communities in response to elevated CO2.mBio. 2011 Jul 26;2(4):e00122-11. doi: 10.1128/mBio.00122-11. Print 2011. mBio. 2011. PMID: 21791581 Free PMC article.
-
Use of multivariate statistics for 16S rRNA gene analysis of microbial communities.Int J Food Microbiol. 2007 Nov 30;120(1-2):95-9. doi: 10.1016/j.ijfoodmicro.2007.06.004. Epub 2007 Jun 12. Int J Food Microbiol. 2007. PMID: 17602772 Review.
Cited by
-
Characteristics of the oral microbiome in youth exposed to caregiving adversity.Brain Behav Immun Health. 2024 Aug 28;41:100850. doi: 10.1016/j.bbih.2024.100850. eCollection 2024 Nov. Brain Behav Immun Health. 2024. PMID: 39280088 Free PMC article.
-
Human nasal microbiota shifts in healthy and chronic respiratory disease conditions.BMC Microbiol. 2024 Apr 27;24(1):150. doi: 10.1186/s12866-024-03294-5. BMC Microbiol. 2024. PMID: 38678223 Free PMC article.
-
Fungal Community Succession and Volatile Compound Changes during Fermentation of Laobaigan Baijiu from Chinese Hengshui Region.Foods. 2024 Feb 14;13(4):569. doi: 10.3390/foods13040569. Foods. 2024. PMID: 38397546 Free PMC article.
-
Impact of the diet in the gut microbiota after an inter-species microbial transplantation in fish.Sci Rep. 2024 Feb 18;14(1):4007. doi: 10.1038/s41598-024-54519-6. Sci Rep. 2024. PMID: 38369563 Free PMC article.
-
Murine cartilage microbial DNA deposition occurs rapidly following the introduction of a gut microbiome and changes with obesity, aging, and knee osteoarthritis.Geroscience. 2024 Apr;46(2):2317-2341. doi: 10.1007/s11357-023-01004-z. Epub 2023 Nov 9. Geroscience. 2024. PMID: 37946009 Free PMC article.
References
-
- Pyke CR, Condit R, Aguilar S, Lao S. Floristic composition across a climatic gradient in a neotropical lowland forest. Journal of Vegetation Science. 2001;12:553–566. doi: 10.2307/3237007. - DOI
Publication types
MeSH terms
Substances
LinkOut - more resources
Full Text Sources
Other Literature Sources
Miscellaneous

