

Stable and dynamic nucleosome states during a meiotic developmental process
- PMID: 21515815
- PMCID: PMC3106320
- DOI: 10.1101/gr.117465.110
Stable and dynamic nucleosome states during a meiotic developmental process
Abstract
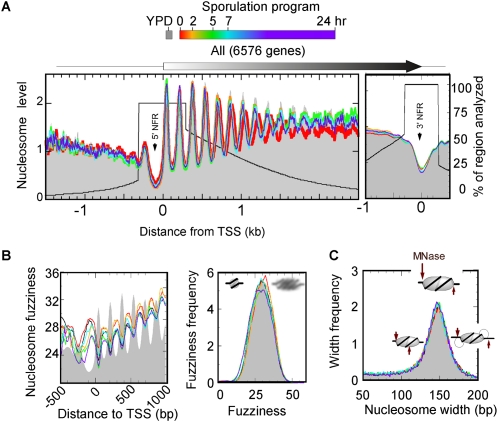
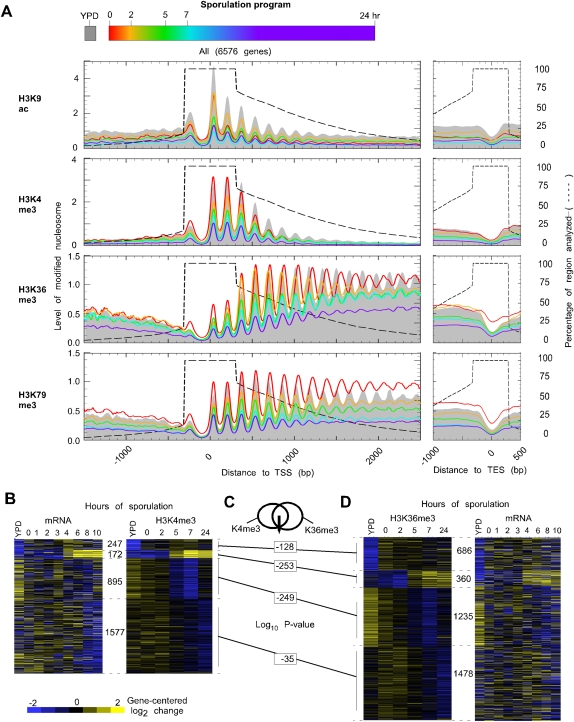
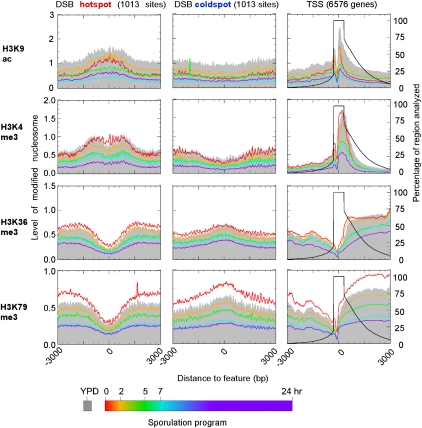
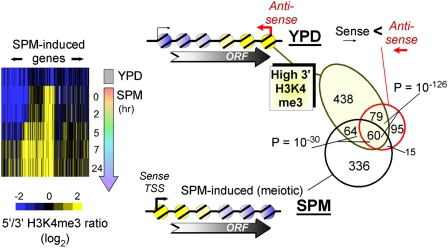
The plasticity of chromatin organization as chromosomes undergo a full compendium of transactions including DNA replication, recombination, chromatin compaction, and changes in transcription during a developmental program is unknown. We generated genome-wide maps of individual nucleosome organizational states, including positions and occupancy of all nucleosomes, and H3K9 acetylation and H3K4, K36, K79 tri-methylation, during meiotic spore development (gametogenesis) in Saccharomyces. Nucleosome organization was remarkably constant as the genome underwent compaction. However, during an acute meiotic starvation response, nucleosomes were repositioned to alter the accessibility of select transcriptional start sites. Surprisingly, the majority of the meiotic programs did not use this nucleosome repositioning, but was dominated by antisense control. Histone modification states were also remarkably stable, being abundant at specific nucleosome positions at three-quarters of all genes, despite most genes being rarely transcribed. Our findings suggest that, during meiosis, the basic features of genomic chromatin organization are essentially a fixed property of chromosomes, but tweaked in a restricted and program-specific manner.
Figures


Similar articles
-
Partitioning the C. elegans genome by nucleosome modification, occupancy, and positioning.Chromosoma. 2010 Feb;119(1):73-87. doi: 10.1007/s00412-009-0235-3. Epub 2009 Aug 25. Chromosoma. 2010. PMID: 19705140 Free PMC article.
-
The linker histone plays a dual role during gametogenesis in Saccharomyces cerevisiae.Mol Cell Biol. 2012 Jul;32(14):2771-83. doi: 10.1128/MCB.00282-12. Epub 2012 May 14. Mol Cell Biol. 2012. PMID: 22586276 Free PMC article.
-
In vivo effects of histone H3 depletion on nucleosome occupancy and position in Saccharomyces cerevisiae.PLoS Genet. 2012;8(6):e1002771. doi: 10.1371/journal.pgen.1002771. Epub 2012 Jun 21. PLoS Genet. 2012. PMID: 22737086 Free PMC article.
-
[Cross-fire over the nucleosome: molecular basis of post-meiotic male haploid genome compaction].Med Sci (Paris). 2012 May;28(5):485-9. doi: 10.1051/medsci/2012285012. Epub 2012 May 30. Med Sci (Paris). 2012. PMID: 22643001 Review. French.
-
[Histone modification and regulation of chromatin function].Genetika. 2006 Sep;42(9):1170-85. Genetika. 2006. PMID: 17100086 Review. Russian.
Cited by
-
Defining flexible vs. inherent promoter architectures: the importance of dynamics and environmental considerations.Nucleus. 2012 Sep-Oct;3(5):399-403. doi: 10.4161/nucl.21172. Epub 2012 Jul 3. Nucleus. 2012. PMID: 22751015 Free PMC article.
-
Transcription of two long noncoding RNAs mediates mating-type control of gametogenesis in budding yeast.Cell. 2012 Sep 14;150(6):1170-81. doi: 10.1016/j.cell.2012.06.049. Epub 2012 Sep 6. Cell. 2012. PMID: 22959267 Free PMC article.
-
Repression of meiotic genes by antisense transcription and by Fkh2 transcription factor in Schizosaccharomyces pombe.PLoS One. 2012;7(1):e29917. doi: 10.1371/journal.pone.0029917. Epub 2012 Jan 6. PLoS One. 2012. PMID: 22238674 Free PMC article.
-
Timing of transcriptional quiescence during gametogenesis is controlled by global histone H3K4 demethylation.Dev Cell. 2012 Nov 13;23(5):1059-71. doi: 10.1016/j.devcel.2012.10.005. Epub 2012 Nov 1. Dev Cell. 2012. PMID: 23123093 Free PMC article.
-
Widespread misinterpretable ChIP-seq bias in yeast.PLoS One. 2013 Dec 9;8(12):e83506. doi: 10.1371/journal.pone.0083506. eCollection 2013. PLoS One. 2013. PMID: 24349523 Free PMC article.
References
-
- Albert I, Mavrich TN, Tomsho LP, Qi J, Zanton SJ, Schuster SC, Pugh BF 2007. Translational and rotational settings of H2A.Z nucleosomes across the Saccharomyces cerevisiae genome. Nature 446: 572–576 - PubMed
-
- Barski A, Cuddapah S, Cui K, Roh TY, Schones DE, Wang Z, Wei G, Chepelev I, Zhao K 2007. High-resolution profiling of histone methylations in the human genome. Cell 129: 823–837 - PubMed
Publication types
MeSH terms
Substances
Grants and funding
LinkOut - more resources
Full Text Sources
Other Literature Sources
Research Materials