. 2011 May 20;42(4):451-64.
doi: 10.1016/j.molcel.2011.04.005. Epub 2011 Apr 21.

Genome-wide regulation of 5hmC, 5mC, and gene expression by Tet1 hydroxylase in mouse embryonic stem cells

Affiliations

Genome-wide regulation of 5hmC, 5mC, and gene expression by Tet1 hydroxylase in mouse embryonic stem cells

Yufei Xu et al. Mol Cell. .

Abstract

DNA methylation at the 5 position of cytosine (5mC) in the mammalian genome is a key epigenetic event critical for various cellular processes. The ten-eleven translocation (Tet) family of 5mC-hydroxylases, which convert 5mC to 5-hydroxymethylcytosine (5hmC), offers a way for dynamic regulation of DNA methylation. Here we report that Tet1 binds to unmodified C or 5mC- or 5hmC-modified CpG-rich DNA through its CXXC domain. Genome-wide mapping of Tet1 and 5hmC reveals mechanisms by which Tet1 controls 5hmC and 5mC levels in mouse embryonic stem cells (mESCs). We also uncover a comprehensive gene network influenced by Tet1. Collectively, our data suggest that Tet1 controls DNA methylation both by binding to CpG-rich regions to prevent unwanted DNA methyltransferase activity, and by converting 5mC to 5hmC through hydroxylase activity. This Tet1-mediated antagonism of CpG methylation imparts differential maintenance of DNA methylation status at Tet1 targets, ultimately contributing to mESC differentiation and the onset of embryonic development.


Figures

Figure 1
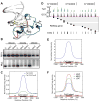
Figure 1. Tet1 binds to CpG-rich DNA via its CXXC domain
(A) Superposition of the model of the human TET1 CXXC domain with the crystal structure of CFP1 CXXC-CpG DNA complex. The TET1 model (green) and the CFP1 crystal structure (blue) are shown in cartoon. The DNA is shown in a cartoon representation and the 5m-cytosines in the CpG motif are displayed in a stick model with its backbone colored in orange. The CXXC domain binds 2 zinc ions, which are displayed in gray balls. The CpG binding motif in the CFP1 CXXC structure and the corresponding motif in TET1 CXXC are shown in salmon color, and the extra sequence motif (DMKFGG) in the CFP1 CXXC that lacks in TET1 CXXC is colored in red. (B) GST pull-down assay to determine the binding activities of human TET1 CXXC domain (upper panel) and MLL CXXC domain (lower panel) to CpG, 5mCpG and 5hmCpG containing DNA (generated by PCR, see Figure S1A, S1B) under different NaCl concentration. Data showing here is one representative from three independent assays. (C) Normalized distribution profiles of Tet1 CXXC domain (blue) and Tet1 CXXC domain mutant2 (green) bound mESCs genomic DNA across CpG islands (CGIs). The CGIs annotation (mm9) was obtained from the UCSC website, and each CGI was normalized to 0–100%. Tag densities in the two profiles were normalized by their total reads number and plotted from 200% upstream to 200% downstream of the normalized CGI. (D) Representative region (chr18: 37,088,056–37,188,452) to show the correlation of Tet1 binding with GC% and CGIs in mESCs. (E–F) Normalized Tet1 tag density distribution across total CGIs (E) or with GC content classifications (F). In panel F, CGIs were sorted by GC% from high to low, and equally divided into 5 groups. The first, third, and fifth groups were chosen as HGC (red), MGC (green) and LGC (blue), respectively.
Figure 2
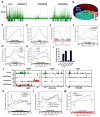
Figure 2. Tet1 is enriched at gene promoters and positively correlates with promoter CpG content and H3K4me3
(A) Representative Tet1 ChIP-seq results and associated histone modification patterns. Arrow denotes promoter orientation. (B) Genomic distribution of Tet1-enriched regions. The genomic features (exons, introns, and intergenic regions) were defined based on RefSeq gene (mm9) annotations. Promoter was defined as −2kb to +2kb relative to TSS. (C) Normalized Tet1 tag density distribution across the gene body. Each gene body was normalized to 0–100%. Normalized Tag density is plotted from 20% of upstream of TSSs to 20% downstream of TTSs. (D) Normalized Tet1 tag density distribution across exons. Each exon is normalized to 0–100%. Normalized Tet1 density is plotted from 200% upstream to 200% downstream of the normalized exon. (E) Normalized Tet1 tag density distribution across gene bodies with promoter classifications. The high CpG promoters (HCPs), intermediate CpG promoters (ICPs) and low CpG promoters (LCPs) were defined as described previously (Meissner et al., 2008; Mikkelsen et al., 2007). Each gene body region was normalized to 0–100%. Normalized tag density is shown from 20% upstream of TSSs to 20% downstream of TTSs. (F) The correlations between Tet1 and H3K4me3 (left) or H3K27me3 (right) tag densities at gene promoters. H3K4me3 and H3K27me3 densities were obtained from the reference (Mikkelsen et al., 2007). Tet1, H3K4me3, and H3K27me3 values at promoters were calculated as log10 (tag density). (G) Normalized Tet1 tag density distributions at ‘univalent’ H3K4me3 (red), ‘univalent’ H3K27me3 (blue) and ‘bivalent’ (green) promoters. Promoters were classified according to their histone modification patterns (Mikkelsen et al., 2007). Tet1 enrichment from −5kb to +5kb relative to TSSs is shown.
Figure 3
Figure 3. Genome-wide distribution of 5hmC in mESCs
(A) The distribution of 5hmC density (green) in the region of chr2: 90,353,915–106,163,465 by hMeDIP-seq. Refseq genes (blue) are shown under 5hmC peaks. (B) Genomic distribution of 5hmC-enriched regions. (C–E) Normalized 5hmC tag density distribution across the gene body (C), exon (D) or exon-intron boundary (E). Normalized tag density is plotted from −100bp to 100bp relative to exon-intron boundaries in panel E. (F–G) Normalized 5hmC tag density distribution across CGIs with genomic location (F) or GC content (G) classifications. In panel F, CGIs were grouped into promoter (−2k to +2k relative to TSS, green), gene body (+2k to TTS, red), and intergenic CGIs (TTS to −2k of the downstream gene, blue) based on their locations. In panel G, CGIs were sorted by GC% from high to low, and equally divided into 5 groups. The first, third, and fifth groups were chosen as HGC (red), MGC (green) and LGC (blue), respectively. (H) Normalized 5hmC tag density distribution across the genes with HCPs (red), ICPs (green) or LCPs (blue). (I) hMeDIP q-PCR to detect 5hmC levels. Results are shown as mean +/− SEM (n=3). The targeting region for each primer set is underlined in panel J. Arrow denotes promoter orientation. (J) hMeDIP-seq results of Gli1 (HCP) and Scnn1a and Trim29 (ICPs) genes. (K) Normalized 5hmC tag density distribution across the genes with ‘univalent’ H3K4me3 (red), ‘univalent’ H3K27 me3 (blue) or ‘bivalent’ (green) promoters. (L) Normalized 5hmC tag density distribution across genes with high (red), medium (green) or low (blue) expression levels. Genes were sorted by their expression levels identified in microarray assay from high to low, and equally divided into 5 groups. The first, third and fifth groups were chosen as genes with high-, medium- and low-expression levels, respectively. (M) Normalized 5hmC tag density distribution relative to the average gene body in mouse ESCs (blue) and cerebellum (green) (Song et al., 2011). Tag densities in these two groups were normalized by their total reads number and shown from 20% upstream of TSSs to 20% downstream of TTSs.
Figure 4
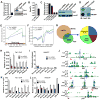
Figure 4. Tet1 regulates 5hmC levels in its targeted gene promoters and exons
(A) siRNA-mediated Tet1 depletion at mRNA (left, by RT-qPCR) and protein (right, by western blot) levels. RT-qPCR data are presented as mean +/− SEM (n=3). Actb was used as loading control. (B) Global 5hmC level decrease caused by siRNA-mediated Tet1 depletion by HPLC assay. Results are shown as mean +/− SEM (n=3). (C) Specific shRNAs-mediated Tet1 depletion at both mRNA (left, by RT-qPCR) and protein (right, by western blot) levels. RT-qPCR results are shown as mean +/− SEM (n=4). Lamb1 was used as loading control. (D) Dot blot assay showing the global 5hmC level decrease after shRNA-mediated Tet1 depletion. The same amount of genome DNA from Scr shRNA or Tet1 shRNA3387 treated mESCs was processed for hMeDIP. The same quantity of input DNA and same volume of hMeDIPed DNA were blotted onto NC membrane and performed dot-blot assay using 5hmC antibody. (E–F) The differential average 5hmC levels in Luc shRNA (green, control) and Tet1 shRNA2863 (blue) treated mESCs though out the gene (E) or at gene promoters (F). Two group 5hmC tag densities were normalized by their total reads number for comparison. The TSS is noted by a dash line in panel F. (G) Tet1 peaks overlapped with 5hmC and their distributions. (H–I) Tet1 occupancy (H) and 5hmC levels (I) changes at Tet1 targeted promoters after Tet1 depletion by ChIP-qPCR and hMeDIP-qPCR, respectively. Data are presented as mean +/− SEM (n=3). (J) Representative genes show good 5hmC and Tet1 correlation in Tet1-targeted exons. The targeting regions of primers used in panel K and L are noted by blue rectangles. (K–L) Tet1 occupancy (K) and 5hmC levels (L) changes at Tet1 bound exons after Tet1 depletion by ChIP-qPCR and hMeDIP-qPCR, respectively. Data are presented as mean +/− SEM (n=3).
Figure 5
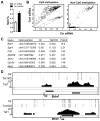
Figure 5. Tet1 regulates the DNA methylation status at target gene promoters
(A) Global 5mC level increase after siRNA-mediated Tet1 depletion by HPLC assay. Results are shown as mean +/− SEM (n=3). (B) Global analysis of DNA methylation after siRNA-mediated Tet1 depletion by targeted bisulfite sequencing. The differential CpG methylation (left) and non-CpG methylation (right) are presented. CpG or non-CpG methylation levels were extracted from mapped reads. The resulting values are real numbers ranging from 0 to 1, corresponding to completely unmethylated to completely methylated. (C) Examples of increased CpG methylation after Tet1 knockdown (KD) and associated genes. The CpG methylation levels are shown as numbers from 0 to 1, corresponding to completely unmethylated to completely methylated. “#”: the methylation level differences at all listed CpG sites are statistically significant (see Figure S5E). (D) Representative regions in Bdnf and Mest genes show the significantly increased CpG methylation caused by Tet1 KD. Each bar represents single CpG methylation. Note that unique bars in Tet1 KD sample show the significant CpG methylation increase (from undetectable in control to detectable) and that most of those sites are overlapped with Tet1 peaks or flanking around Tet1 peaks, indicating the role of Tet1 in regulating CpG methylation at those sites. Arrow denotes promoter orientation.
Figure 6
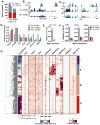
Figure 6. Tet1 plays both positive and negative roles in target gene regulation in mESCs
(A) Using 1.5-fold as a cut-off value, all differentially expressed genes in the microarray assay were selected and further classified into Tet1 bound and unbound genes. (B–C) Representative mRNA-seq results. Arrow denotes promoter orientation. (D) RT-qPCR confirms the differentially expressed genes after Tet1 depletion. Results are shown as mean +/− SEM (n=4). (E) Tet1 ChIP-qPCR reveals that Tet1 binds to the Ngn2 promoter and Tet1 depletion causes the significantly decreased Tet1 occupancy at the Ngn2 promoter in mESCs. Data are presented as mean +/− SEM (n=3). (F) Tet1 depletion delayed the Ngn2 induction during neural differentiation. ESCs were infected with control or Tet1 shRNA containing lentivirus, selected with puromycin and differentiated by LIF withdraw for 3 days. The formed embryonic bodies were treated with 1μM RA for 3 days. Ngn2 expression was examined by RT-qPCR. Results of three independent experiments are shown. (G) Hierarchical clustering of epigenetic and transcriptional features of Tet1 target genes. The histone methylation, DNA methylation and RNA Pol II profiles in mESCs were obtained from the references (Meissner et al., 2008; Mikkelsen et al., 2007). Top 300 Tet1 target genes based on the variance of expression and epigenetic modifications density score were chosen to make the cluster. The tag densities of Tet1 binding, 5hmC, 5mC, H3K4me3, H3K27me3, H3k36me3, H3K9me3 and RNA Pol II were profiled through −10kb to +10kb relative to the TSS of each gene with bin of 500bp. The middle color bar indicates the difference of mRNA levels between Scr shRNA- and Tet1 shRNA2863- or Tet1 shRNA3387-treated mESCs.
Figure 7
Figure 7. A Model of Tet1 functions in regulating euchromatin CpG methylation
Tet1 strongly binds to unmethylated-CpG rich regions (such as gene promoters, CGIs) via its CXXC domain, limiting the accessibility of DNMTs. Tet1 also binds to dispersedly methylated-CpGs in euchromatin (shown as green nucleosomes) and converts 5mC to 5hmC. The newly generated 5hmC may further limit the binding of methyl-binding proteins (MBDs) or DNMTs. However, densely-methylated CpGs can recruit MBDs, which subsequently recruits repressive histone modifiers such as H3K9me3 methyltransferases to establish a heterochromatin state (shown as dark blue nucleosomes), making Tet1 inaccessible to these hypermethylated sites and preventing the conversion from 5mC to 5hmC. Arrow denotes the gene promoter. Please refer to the related text for more details.

Similar articles

Cited by

References

    1. Boyer LA, Mathur D, Jaenisch R. Molecular control of pluripotency. Curr Opin Genet Dev. 2006;16:455–462. - PubMed
    1. Chodavarapu RK, Feng S, Bernatavichute YV, Chen PY, Stroud H, Yu Y, Hetzel JA, Kuo F, Kim J, Cokus SJ, et al. Relationship between nucleosome positioning and DNA methylation. Nature. 2010;466:388–392. - PMC - PubMed
    1. Deng J, Shoemaker R, Xie B, Gore A, LeProust EM, Antosiewicz-Bourget J, Egli D, Maherali N, Park IH, Yu J, et al. Targeted bisulfite sequencing reveals changes in DNA methylation associated with nuclear reprogramming. Nat Biotech. 2009;27:353–360. - PMC - PubMed
    1. Fang R, Barbera AJ, Xu Y, Rutenberg M, Leonor T, Bi Q, Lan F, Mei P, Yuan GC, Lian C, et al. Human LSD2/KDM1b/AOF1 regulates gene transcription by modulating intragenic H3K4me2 methylation. Mol Cell. 2010;39:222–233. - PMC - PubMed
    1. Fouse SD, Shen Y, Pellegrini M, Cole S, Meissner A, Van Neste L, Jaenisch R, Fan G. Promoter CpG methylation contributes to ES cell gene regulation in parallel with Oct4/Nanog, PcG complex, and histone H3 K4/K27 trimethylation. Cell Stem Cell. 2008;2:160–169. - PMC - PubMed

Publication types

MeSH terms

Associated data