. 2011 May 20;332(6032):974-7.
doi: 10.1126/science.1206095. Epub 2011 Apr 21.

The Toll-like receptor 2 pathway establishes colonization by a commensal of the human microbiota

Affiliations

The Toll-like receptor 2 pathway establishes colonization by a commensal of the human microbiota

June L Round et al. Science. .

Abstract

Mucosal surfaces constantly encounter microbes. Toll-like receptors (TLRs) mediate recognition of microbial patterns to eliminate pathogens. By contrast, we demonstrate that the prominent gut commensal Bacteroides fragilis activates the TLR pathway to establish host-microbial symbiosis. TLR2 on CD4(+) T cells is required for B. fragilis colonization of a unique mucosal niche in mice during homeostasis. A symbiosis factor (PSA, polysaccharide A) of B. fragilis signals through TLR2 directly on Foxp3(+) regulatory T cells to promote immunologic tolerance. B. fragilis lacking PSA is unable to restrain T helper 17 cell responses and is defective in niche-specific mucosal colonization. Therefore, commensal bacteria exploit the TLR pathway to actively suppress immunity. We propose that the immune system can discriminate between pathogens and the microbiota through recognition of symbiotic bacterial molecules in a process that engenders commensal colonization.


Figures

Fig.1
Fig.1
PSA actively suppresses Th17 cell development during B. fragilis colonization. (A) Colonic lamina propria lymphocytes (LPLs) were harvested and stained with anti-CD4 and IL-17A, and analyzed by flow cytometry (FC). Numbers indicate the percentage of CD4+IL-17A+ (Th17) cells. Conventional mice are specific pathogen free (SPF). (B) Compiled data from three independent experiments as in (A). CV: conventional; GF: germ-free; B.frag: B. fragilis; ΔPSA: B. fragilisΔPSA. ***p value <0.001. (C and D) CD4+ T cells were isolated from the mesenteric lymph nodes (MLNs) of indicated animals. RNA was collected and used as a template to determine the relative levels of IL-17A (C) and RORγt (D) transcript. Error bars represent standard deviations (SD) from triplicate samples. (E) CD4+ T cells were purified from the MLNs of indicated mice and stimulated with plate bound anti-CD3 alone (light gray bars; media) or in addition to TGF-β (gray bars) or with TGF-β and IL-6 (dark gray bars). IL-17A secretion was determined by ELISA. These data are representative of three independent experiments. Error bars represent SD from triplicate samples. (F) SFB mono-associated mice were treated orally with either PBS or PSA. Colonic LPLs were isolated and the percentage of CD4+IL-17A-producing cells was determined by FC. Each symbol in the right panel represents an individual animal and shows the percentage of CD4+IL-17A+ cells. **p value <0.01. (G) B. fragilisΔPSA mono-associated mice were treated with either PBS or PSA and the LPLs were isolated and the percentage of CD4+IL-17A-producing cells was determined. Each symbol in the panel represents an individual animal. **p value <0.01.
Fig. 2
Fig. 2
Tregs suppress Th17 responses during B. fragilis colonization. (A to D) Ablation of Tregs leads to Th17 responses during B. fragilis colonization. Germ-free RAG−/− animals were reconstituted with bone marrow from Foxp3-DTR mice and subsequently mono-associated with B. fragilis. Animals were either treated with PBS (-DT) or diphtheria toxin (+DT) as described (18). Colonic LPLs were harvested following Treg ablation, and restimulated with PMA/ionomycin and Brefeldin A. Cells were stained with anti-CD4, Foxp3, and IL-17A. (A) and (C) show FC plots for Tregs and Th17 cells. Symbols in panels (B) and (D) represent T cell proportions from individual mice within a single experiment, and are representative of two independent trials. ***p value <0.001
Fig. 3
Fig. 3
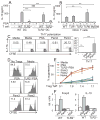
PSA directly signals through TLR2 on CD4+ T cells. (A) PSA requires TLR2 expression on T cells for IL-10 production. Bone marrow-derived dendritic cells (BMDCs) from WT or TLR2−/− animals were incubated with splenic CD4+ T cells. Co-cultures were incubated with TGF-β and anti-CD3. Levels of secreted IL-10 were determined by ELISA. Error bars represent SD from 2 independent assays performed in quadruplicate and are representative of three independent trials. ***p value <0.001, NS; not significant. (B) CD4+ T cells were isolated from wild-type (WT) and the indicated knock-out mice and cells were stimulated as in (A). IL-10 was assayed by ELISA. **p value <0.01. Error bars represent SD for quadruplicate samples and are representative of two independent trials. (C) CFSE-pulsed CD4+Foxp3− cells were cultured in the presence of plate-bound anti-CD3, TGF-β, IL-6 and the indicated TLR ligands or PSA. Three days post-culture, cells were restimulated with PMA/Ionomycin and the percentage of CD4+CFSE+IL-17A+ expressing cells were determined by FC. CFSE dilution represents cell proliferation. The panel on the right summarizes data with SD from two independent trials performed in triplicate. **p value <0.01; ***p value <0.001. (D and E) PSA enhances suppressive activity of Foxp3+ Tregs directly through TLR2. CD4+Foxp3+ Tregs were purified from Foxp3EGFP mice (28) and TLR2−/− X Foxp3EGFP mice and stimulated with plate-bound anti-CD3 and TGF-β with PSA or with indicated TLR ligands for 48 hrs. Equal numbers of live cultured Tregs were subsequently incubated with CFSE-pulsed responder cells (CD4+Foxp3−). Numbers along the bottom of (E) represent the ratio of Tregs to T effector cells. Percent (%) suppression is determined by the ratio of proliferating responder cells in each condition relative to proliferation in the absence of added Tregs. Error bars in (E) are SD from a single experiment performed in duplicate and are representative of two independent trials. (F) Purified CD4+Foxp3+ Tregs were stimulated as in (D), and qRT-PCR was performed for foxp3 and il10. Error bars are SD from a single trial in triplicate and are representative of two independent trials.
Fig. 4
Fig. 4
B. fragilis suppresses host Th17 cell responses through T cell intrinsic TLR2 signaling. (A and B) T cell specific TLR2 is required for the ability of PSA to suppress Th17 development. Germ-free RAG−/− animals were reconstituted with CD4+ T cells from WT or TLR2−/− mice and subsequently mono-associated with either WT B. fragilis or B. fragilisΔPSA. Colonic LPLs were isolated and analyzed for Th17 cell proportions by FC. Plots are gated on CD4+ cells. (B) Each symbol represents an individual animal. **p value <0.01; ***p value <0.001. (C) CD4+ T cells were isolated from the MLNs of indicated animals and re-stimulated with plate bound anti-CD3 in the presence of TGF-β and IL-6. IL-17A from these cultures was analyzed by ELISA. Error bars show SD from triplicate samples and are representative of two independent trials.
Fig. 5
Fig. 5
Mucosal colonization of B. fragilis requires suppression of host Th17 responses. (A) A population of B. fragilis is associated with the colonic mucosa. Colons from germ-free or B. fragilis mono-associated mice were fixed, stained with chicken anti-B. fragilis (green) and nuclear counterstained with DAPI (white) and imaged by whole mount confocal microscopy. Images are similar to five different z-stack images per colon, and representative of 5 mice. (B) Colon sections or luminal contents from B. fragilis mono-associated mice were homogenized and serially diluted to obtain live bacterial counts. CFUs (colony forming units) per gram of tissue were determined after microbiologic plating. Each symbol represents an individual animal. ***p value <0.001. (C) qRT-PCR analysis was performed using Bacteriodes-specific primers on RNA extracted from colon tissue or luminal contents. GF: germ-free; B.frag: B. fragilis. Error bars represent SD from individual mice in the same experiment and are representative of two independent trials. (D) qRT-PCR analysis for B. fragilis was performed on RNA extracted from colon homogenates from indicated animals. The bar furthest to the right shows colonization of B. fragilisΔPSA in animals orally treated with purified PSA. GF: germ-free; B.frag: B. fragilis; ΔPSA: B. fragilisΔPSA. Data shown for 4 animals per group, and are representative of 2 independent trials. **p value < 0.01. (E) B. fragilis is able to colonize the mucosa in the presence of other Th17 inducing organisms. Germ-free animals were colonized with SFB alone, or co-colonized with B. fragilis & SFB or B. fragilisΔPSA & SFB. RNA was extracted from colon homogenates and primers specific for Bacteroides were used to determine the relative abundance of tissue associated B. fragilis. Data shown for 4 animals per group, and are representative of 2 independent trials. *p value <0.05. (F) TLR2 deletion on CD4+ T cells leads to decreased B. fragilis mucosal colonization. Germ-free RAG−/− animals were reconstituted with TLR2−/− or WT CD4+ T cells and colonized with either WT B. fragilis or B. fragilisΔPSA. Colons were prepared and analyzed as in panel (D). **p value < 0.01. (G) Ablation of Tregs leads to decreased B. fragilis mucosal colonization. Germ-free RAG−/− animals were reconstituted with Foxp3-DTR bone and colonized. Two months post-reconstitution animals were treated with PBS (+Tregs) or with DT (-Tregs), and colons prepared as described in panel (D). **p value < 0.01. (H and I) Neutralization of IL-17A increases B. fragilis colonization. Germ-free animals were colonized with B. fragilisΔPSA and either treated with an antibody that neutralizes IL-17A (α-IL17A) or an isotype control. Colon homogenates were analyzed by live bacterial plating (H) or qRT-PCR (I) as described above. Each symbol in (H) represents an individual animal. Error bars in (I) show SD from triplicate samples and are representative of two independent trials. *p value <0.05.

Comment in

Similar articles

Cited by

References

    1. Ley RE, Peterson DA, Gordon JI. Cell. 2006 Feb 24;124:837. - PubMed
    1. Round JL, Mazmanian SK. Nat Rev Immunol. 2009 May;9:313. - PMC - PubMed
    1. Medzhitov R. Nature. 2007 Oct 18;449:819. - PubMed
    1. Manicassamy S, Pulendran B. Semin Immunol. 2009 Aug;21:185. - PMC - PubMed
    1. Fukata M, et al. J Immunol. 2008 Feb 1;180:1886. - PMC - PubMed

Publication types

MeSH terms