. 2011 Jun;12(6):565-73.
doi: 10.1038/embor.2011.54. Epub 2011 Apr 21.

MiD49 and MiD51, new components of the mitochondrial fission machinery

Affiliations

MiD49 and MiD51, new components of the mitochondrial fission machinery

Catherine S Palmer et al. EMBO Rep. 2011 Jun.

Abstract

Mitochondria form intricate networks through fission and fusion events. Here, we identify mitochondrial dynamics proteins of 49 and 51 kDa (MiD49 and MiD51, respectively) anchored in the mitochondrial outer membrane. MiD49/51 form foci and rings around mitochondria similar to the fission mediator dynamin-related protein 1 (Drp1). MiD49/51 directly recruit Drp1 to the mitochondrial surface, whereas their knockdown reduces Drp1 association, leading to unopposed fusion. Overexpression of MiD49/51 seems to sequester Drp1 from functioning at mitochondria and cause fused tubules to associate with actin. Thus, MiD49/51 are new mediators of mitochondrial division affecting Drp1 action at mitochondria.


Conflict of interest statement

The authors declare that they have no conflict of interest.

Figures
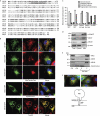
Figure 1
Figure 1
MiD49/51 are mitochondrial outer-membrane proteins that affect mitochondrial morphology. (A) Sequence alignment with conserved residues shown in bold and predicted transmembrane domains underlined. (B) COS7 cells expressing GFP fusion constructs and stained with MitoTracker Red (red) and Hoechst (blue; upper panels). HeLa cells expressing MiD–GFP fusion constructs and immunostained for cytochrome c or Tom20 (lower panels). (C) COS7 cells expressing different constructs were blind-counted for mitochondrial morphology (mean±s.e.m., n=3, 100 cells counted per experiment). (D) Fractionated COS7 cells were analysed by immunoblotting using antibodies as indicated. (E) COS7 mitochondria were subjected to proteinase K (PK) or sodium carbonate (Na Carb) extraction, followed by western blot analysis using antibodies as indicated. (F) MiD491−50–GFP and MiD4950−454–GFP were expressed in COS7 cells and stained with MitoTracker Red and Hoechst. Scale bars, 20 μm. GFP, green fluorescent protein; IMS, intermembrane space; MiD49/51, mitochondrial dynamics proteins of 49 and 51 kDa; Mito, mitochondria; P, pellet; S, supernatant; TMD, transmembrane domain.
Figure 2
Figure 2
Cells expressing MiD51–GFP contain motile mitochondrial tubules that colocalize with F-actin. (A) Confocal time-lapse imaging of COS7 cells expressing MiD51–GFP (supplementary Movie S1 online). Representative images are shown. Solid line denotes cell boundary, dotted line denotes nucleus (N). (B) Confocal images of COS7 cells expressing MiD51– or MiD49–GFP and stained for F-actin. Insets are magnified in the lower panels. (C) Time-lapse images of a COS7 cell coexpressing MiD51–GFP following addition of 10-μM cytochalasin D at t=0. Arrows indicate mitochondrial tubules that retract following cytochalasin D treatment (supplementary Movie S2 online). Solid line denotes cell boundary. (D) Mitochondrial morphology was blind-counted in cells expressing MiD51–GFP following various treatments (mean±s.e.m., n=3, 100 cells counted per experiment). Scale bars, 20 μm. GFP, green fluorescent protein; MiD49/51, mitochondrial dynamics proteins of 49 and 51 kDa.
Figure 3
Figure 3
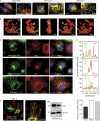
MiD49/51 form foci at mitochondria and alter Drp1 localization. (A) COS7 cells expressing GFP constructs were stained with MitoTracker Red (red) and Hoechst (blue). Insets are magnified in the right panels. All images were obtained at the same exposure. Scale bar, 20 μm. (B) Reconstruction of mitochondria containing MiD49–GFP and stained with MitoTracker Red. Arrows indicate a MiD49–GFP ring at a potential mitochondrial constriction site (supplementary Movie S3 online). Scale bar, 1 μm. (C) COS7 cells expressing MiD49–GFP (low and high fluorescence) or GFP–Miro1 were immunostained for Drp1 (red) and stained with Hoechst. (D) Linescans of cell regions were analysed for Drp1 and GFP fluorescence. Relative fluorescence intensities were measured (n>45), Drp1 colocalization with mitochondria was analysed and the degree of association is shown as Pearson's correlation units (r, bottom panel; mean±s.e.m., n=3). (E) HeLa cells depleted of Drp1 were transfected with a construct expressing MiD51–GFP and stained with MitoTracker Red. MiD51–GFP foci are enlarged in the inset (supplementary Movie S4 online). Scale bars, 20 μm. Western blot analysis confirmed knockdown of Drp1, mitochondrial matrix B17.2L was used as a control. Drp1, dynamin-related protein 1; GFP, green fluorescent protein; MiD49/51, mitochondrial dynamics proteins of 49 and 51 kDa; Miro1, Mitochondrial Rho GTPase 1; Tom7, Translocase of outer membrane 7kDa.
Figure 4
Figure 4
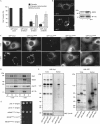
MiD49/51 recruit GFP–Drp1 to the mitochondrial surface. (A) COS7 cells expressing GFP–Drp1 alone or with MiD49, MiD51 or huMilt1 were blind-counted for GFP–Drp1 localization (mean±s.e.m., n=3, 100 cells counted per experiment). (B) Mouse embryonic fibroblasts (MEFs) before (−4HT) and 24 h after (+4HT) induction of MiD51 were stained with MitoTracker Red (red) and visualized by epifluorescence. Western blot analysis confirmed MiD51 induction, with mitochondrial matrix B17.2L as a control. Scale bars, 20 μm. (C) MEFs transfected with GFP constructs were visualized by epifluorescence before (−4HT) and 24 h after (+4HT) MiD51 induction. (D) Western blot analysis of whole-cell (W), mitochondria (M) and cytosolic (C) fractions from MEFs before (−4HT) and after (+4HT) MiD51 expression. Cytosolic Hsc70 and mitochondrial matrix B17.2L acted as controls. (E) By using a yeast two-hybrid assay, a direct interaction between truncated MiD49ΔN120 and Drp1 was observed, similar to the positive control p53 and large T-antigen. MiD49ΔN120 did not interact with the soluble domain of hFis1 or the large T-antigen, similar to the negative control Lamin and T-antigen. (F) Coimmunoprecipitation of endogenous Drp1 with MiD49–GFP following 20-μM bis(maleimido)hexane crosslinking of HeLa cells. Western blot analysis was conducted with antibodies as indicated. Arrow indicates crosslinked species. Drp1, dynamin-related protein 1; GFP, green fluorescent protein; MiD49/51, mitochondrial dynamics proteins of 49 and 51 kDa; Miro1, Mitochondrial Rho GTPase 1; WB, western blot; 4HT, 4-hydroxytamoxifen.
Figure 5
Figure 5
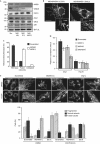
Effect of MiD49/51 RNA interference on mitochondrial morphology and Drp1 distribution. (A) COS7 cells were transfected with either scrambled or MiD-specific RNAi constructs (separately or together). Mitochondrial fractions were isolated 48 h post-transfection and analysed by immunoblotting. (B) Confocal microscopy of COS7 cells co-transfected with mt-Dendra2 and MiD49/MiD51 RNAi constructs. Epifluorescent microscopy of HeLa cells co-transfected with both MiD RNAi constructs then immunostained for cytochrome c. Inset is magnified in the lower right panel. (C) COS7 mitochondrial phenotypes were blind-counted and scored following knockdown (mean±s.e.m., n=3, 100 cells counted per experiment). (D) Confocal imaging of COS7 cells co-transfected with either scrambled or MiD-specific RNAi constructs along with mt-Dendra2 to visualize mitochondria. Cells were fixed and immunostained for Drp1 or Hsc70. Relative fluorescence intensities of 30-μm linescans were measured (n>37). Drp1 or Hsc70 colocalization with mitochondria was analysed and the degree of association was shown as Pearson's correlation units (r; mean±s.e.m., n=3). (E) HeLa cells transfected with scrambled, MiD49/MiD51 RNAi or Drp1 RNAi constructs were incubated for 60 min with either 20-μM CCCP or DMSO. Cells were fixed and probed for cytochrome c and then mitochondrial morphology was blind-counted (mean±s.e.m., n=3, 100 cells counted per experiment). Scale bars, 20 μm. CCCP, carbonyl cyanide m-chlorophenylhydrozone; DMSO, dimethylsulphoxide; Drp1, dynamin-related protein 1; GFP, green fluorescent protein; Mfn, mitofusin 2; MiD49/51, mitochondrial dynamics proteins of 49 and 51 kDa; mt, matrix; RNAi, RNA interference.

Similar articles

Cited by

References

    1. Anesti V, Scorrano L (2006) The relationship between mitochondrial shape and function and the cytoskeleton. Biochim Biophys Acta 1757: 692–699 - PubMed
    1. Bhar D, Karren MA, Babst M, Shaw JM (2006) Dimeric Dnm1–G385D interacts with Mdv1 on mitochondria and can be stimulated to assemble into fission complexes containing Mdv1 and Fis1. J Biol Chem 281: 17312–17320 - PubMed
    1. Bleazard W, McCaffery JM, King EJ, Bale S, Mozdy A, Tieu Q, Nunnari J, Shaw JM (1999) The dynamin-related GTPase Dnm1 regulates mitochondrial fission in yeast. Nat Cell Biol 1: 298–304 - PMC - PubMed
    1. Chang CR, Blackstone C (2007) Cyclic AMP-dependent protein kinase phosphorylation of Drp1 regulates its GTPase activity and mitochondrial morphology. J Biol Chem 282: 21583–21587 - PubMed
    1. Chang CR, Manlandro CM, Arnoult D, Stadler J, Posey AE, Hill RB, Blackstone C (2010) A lethal de novo mutation in the middle domain of the dynamin-related GTPase Drp1 impairs higher order assembly and mitochondrial division. J Biol Chem 285: 32494–32503 - PMC - PubMed

Publication types

MeSH terms