. 2011 Apr 20;31(16):6208-20.
doi: 10.1523/JNEUROSCI.0299-11.2011.

CC chemokine receptor 2 deficiency aggravates cognitive impairments and amyloid pathology in a transgenic mouse model of Alzheimer's disease

Affiliations

CC chemokine receptor 2 deficiency aggravates cognitive impairments and amyloid pathology in a transgenic mouse model of Alzheimer's disease

Gaëlle Naert et al. J Neurosci. .

Abstract

Circulating monocytoid cells have the ability to infiltrate nervous tissue, differentiate into microglia, and clear amyloid-β (Aβ) from the brain of mouse models of Alzheimer's disease. Interaction between the chemokine CCL2 and its CC chemokine receptor 2 (CCR2) plays a critical role in the recruitment of inflammatory monocytes into the injured/diseased brain. Here, we show that CCR2 deficiency aggravates mnesic deficits and amyloid pathology in transgenic mice expressing the chimeric mouse/human β-amyloid precursor protein and presenilin 1 (APP(Swe)/PS1). Indeed, memory impairment was accelerated and enhanced in APP(Swe)/PS1/CCR2(-/-) mice. Apparition of cognitive decline occurred earlier (i.e., at 3 months of age before plaque formation) and correlated with intracellular accumulation of soluble oligomeric forms of Aβ. Memory deficits worsened with age and were aggravated in APP(Swe)/PS1/CCR2(-/-) mice compared with their respective control groups. Soluble Aβ assemblies increased significantly in APP(Swe)/PS1 mice in a context of CCR2 deficiency, whereas the plaque load remained relatively similar in the brain of aging APP(Swe)/PS1 and APP(Swe)/PS1/CCR2(-/-) mice. However, CCR2 deficiency stimulated the expression of TGF-β1, TGF-β receptors, and CX(3)CR1 transcripts in plaque-associated microglia, a pattern that is characteristic of an antiinflammatory subset of myeloid cells. A decreased expression of CCR2 could play a potential role in the etiology of Alzheimer's disease, a neurodegenerative pathology that could be treated by a genetic upregulation of the transgene in monocytoid cells.


Figures

Figure 1.
Figure 1.
CCR2 deficiency accelerates the onset of spatial and contextual memory deficits and aggravates cognitive impairment in APPSwe/PS1 mice. Spatial memory was assessed using the water T-maze test (a–d) in wild-type, CCR2−/−, APPSwe/PS1, and APPSwe/PS1/CCR2−/− mice aged from 3 to 12 months. The numbers of trials (a, b) and the latency (c, d) to accomplish the task were determined during the acquisition (a, c) and reversal learning phases (b, d). APPSwe/PS1/CCR2−/− mice exhibited an earlier and greater spatial memory decline than APPSwe/PS1 mice. The passive avoidance test was used to establish contextual memory deficit (e, f). The latency was determined at 3–12 months of age during the acquisition phase (e) and 24 h after the conditioning test (f) for each group. The latency to enter the dark compartment was already decreased at 6 months of age in APPSwe/PS1/CCR2−/− mice compared with the control groups of mice. Results are expressed as mean ± SEM; n = 8–16 per group; *p < 0.05, **p < 0.01, and ***p < 0.001. *Versus WT at same age; °versus CCR2−/− at same age; #versus APPSwe/PS1 at same age. (Two-way ANOVA was performed and, for each parameter analysis, revealed a significant interaction between the factors of age and genotype. Then, one-way ANOVA at each level of age was performed using Bonferroni's or Tamhane's post hoc test.)
Figure 2.
Figure 2.
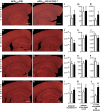
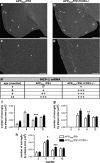
Amyloid plaque burden in the hippocampus of APPSwe/PS1 and APPSwe/PS1/CCR2−/− mice. Brain sections of 3- to 12-month-old APPSwe/PS1 (a–d) and APPSwe/PS1/CCR2−/− mice (e–h) were immunostained for Aβ. Unbiased stereological analysis of plaques was performed in hippocampus to determine plaque density (i–l), plaque size (m–p), and the area percentage occupied by plaques (q–t) of 3- to 12-month-old APPSwe/PS1 (open bar) and APPSwe/PS1/CCR2−/− mice (solid bar). APPSwe/PS1/CCR2−/− and APPSwe/PS1 mice had similar amyloid plaque formation at 3, 6, and 9 months of age. However, a significant higher Aβ load was found in the hippocampus of 12-month-old APPSwe/PS1/CCR2−/− mice. Results are expressed as mean ± SEM; n = 7–15 per group; Student's t test; *p < 0.05 and **p < 0.01 versus APPSwe/PS1 at same age. Scale bar, 500 μm.
Figure 3.
Figure 3.
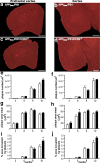
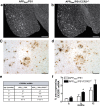
Amyloid plaque formation in the prefrontal cortex and cerebral cortex of APPSwe/PS1 and APPSwe/PS1/CCR2−/− mice. Anti-Aβ immunoreactivity is depicted in the prefrontal cortex (left column) and cerebral cortex (right column) of APPSwe/PS1 (a, b) and APPSwe/PS1/CCR2−/− mice (c, d) at 9 months of age. A detailed analysis of plaque quantification was performed to determine plaque density (e, f), plaque size (g, h), and the area percentage occupied by plaques (i, j) of 3- to 12-month-old APPSwe/PS1 (open bar) and APPSwe/PS1/CCR2−/− mice (solid bar). Amyloid plaque formation was similar in both groups at 3, 6, and 9 months of age, although Aβ plaque load significantly increased in the prefrontal cortex of 12-month-old APPSwe/PS1/CCR2−/− mice. Results are expressed as mean ± SEM; n = 7–15; Student's t test; *p < 0.05 vs APPSwe/PS1 at the same age. Scale bar, 500 μm.
Figure 4.
Figure 4.
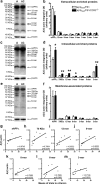
Soluble intracellular Aβ species are increased in 3-month-old APPSwe/PS1/CCR2−/− mice and are strongly correlated with spatial memory decline. Hemibrain extracts from soluble extracellular (a), intracellular (c), and membrane-associated proteins (e) of 3-month-old APPSwe/PS1 (A) and APPSwe/PS1/CCR2−/− (AC) mice were assessed by Western blot on a 10–20% Tris-Tricine denaturing polyacrylamide gel to separate Aβ species using anti-Aβ antibody 6E10. The intensity of each band was quantified by densitometric analysis and normalized per β-actin values. Ratios of Aβ species (Aβ/β-actin) are represented for extracellular (b), intracellular (d), and membrane-associated proteins (f). Please note the increase of soluble intracellular Aβ species in the brain of APPSwe/PS1/CCR2−/− mice. Positive significant correlations exist between spatial memory decline (water T-maze test) and soluble intracellular Aβ species (g–m) and, more importantly, for high-molecular mass products (g–j). Results are expressed as mean ± SEM; n = 4; Student's t test; *p < 0.05 and **p < 0.01, versus APPSwe/PS1. Correlation test was performed using the Spearman's correlation coefficient.
Figure 5.
Figure 5.
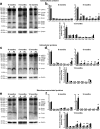
Age-dependent increase of soluble Aβ species in extracellular, intracellular, and membrane-associated fractions extracted from the brain of APPSwe/PS1/CCR2−/− mice. Hemibrain extracts from soluble extracellular (a), intracellular (c), and membrane-associated proteins (e) of 6- to 12-month-old APPSwe/PS1 (A) and APPSwe/PS1/CCR2−/− (AC) mice were assessed by Western blot. The intensity of each band was quantified by densitometric analysis and normalized per β-actin values. Aβ species ratios (Aβ/β-actin) are represented for extracellular (b), intracellular (d), and membrane-associated proteins (f). Soluble Aβ species levels were generally higher in the brains of APPSwe/PS1/CCR2−/− mice than those of APPSwe/PS1 mice. Results are expressed as mean ± SEM; n = 4–5; Student's t test; *p < 0.05, **p < 0.01, and ***p < 0.001. *Versus APPSwe/PS1 at the same age.
Figure 6.
Figure 6.
TGF-β1 and TGF-β receptor 1 and 2 mRNA levels are strongly increased in microglia surrounding plaques of CCR2-deficient APPSwe/PS1 mice. Representative dark-field photomicrographs of in situ hybridization showing the cortical expression of TGF-β1 (a, b), TFG-β-R1 (d, e), and TGF-β-R2 mRNA (g, h) in the brain of 9-month-old APPSwe/PS1 (left column) and APPSwe/PS1/CCR2−/− mice (middle column). Brain sections of 12-month-old APPSwe/PS1/CCR2−/− mice were stained with an anti-iba1 antibody and peroxidase-conjugated secondary antibody, and thereafter hybridized with a mouse TGF-β1 (c), TGF-β-R1 (f), or TGF-β-R2 (i) cRNA probe. Each transcript (agglomeration of silver grains) is clearly expressed in microglia associated to plaques (brown cells). Qualitative quantification was performed for each transcript in the whole brain of 3- to 12-month-old APPSwe/PS1 and APPSwe/PS1/CCR2−/− mice (n = 5–10 per group). CCR2 deficiency clearly increased microglial expression of TGF-β1 and TGF-β-R2 around Aβ plaques of APPSwe/PS1 mice. Scale bars: Left and middle panels, 500 μm; right panel, 20 μm.
Figure 7.
Figure 7.
CCR2 deficiency increases MCP-1 expression and microglial recruitment around Aβ plaque formation in APPSwe/PS1 mice. Representative dark-field photomicrographs of in situ hybridization showing MCP-1 expression in brains of 9-month-old APPSwe/PS1 (left column) and APPSwe/PS1/CCR2−/− mice (right column). Qualitative analysis of brains hybridized with a MCP-1 probe from 3- to 12-month-old mice (n = 5–10 per group) shows an enhanced expression in APPSwe/PS1/CCR2−/− mice (e). Increased expression of MCP-1 is concomitant with an increase recruitment of microglia in the plaque vicinity in prefrontal cortex (f), hippocampus (g), and cortex (h). Results are expressed as mean ± SEM; n = 7–15; Student's t test; *p < 0.05, **p < 0.01, and ***p < 0.001. *Versus APPSwe/PS1 at same age. Arrowheads, MCP-1 positive signal. Scale bars: a, b, 500 μm; c, d, 200 μm.
Figure 8.
Figure 8.
Increased expression of CX3CR1 mRNA in microglia surrounding Aβ plaques of APPSwe/PS1/CCR2−/− mice. Representative dark-field photomicrographs of cortical brain sections hybridized with radioactive cRNA probe for CX3CR1 mRNA of 9-month-old APPSwe/PS1 (a) and APPSwe/PS1/CCR2−/− mice (b). CX3CR1 mRNA signal always colocalized with iba1-immunoreactive cells (brown cells), as shown by double-labeled cells in 12-month-old APPSwe/PS1 (c) and APPSwe/PS1/CCR2−/− mice (d). Note the particular ring formation of microglia strongly expressing CX3CR1 mRNA. Qualitative analysis of CX3CR1 indicated an increased expression signal from 3 to 12 months of age in APPSwe/PS1/CCR2−/− mice (e) (n = 3–5). Such a tendency was validated by measuring the area containing CX3CR1-positive message in cortex on dark-field photomicrographs (f). Results are expressed as mean ± SEM; n = 3–4; Student's t test; *p < 0.05 versus APPSwe/PS1 at same age. Scale bars: a, b, 500 μm; c, d, 50 μm.

Similar articles

Cited by

References

    1. Auffray C, Fogg DK, Narni-Mancinelli E, Senechal B, Trouillet C, Saederup N, Leemput J, Bigot K, Campisi L, Abitbol M, Molina T, Charo I, Hume DA, Cumano A, Lauvau G, Geissmann F. CX3CR1+ CD115+ CD135+ common macrophage/DC precursors and the role of CX3CR1 in their response to inflammation. J Exp Med. 2009;206:595–606. - PMC - PubMed
    1. Babcock AA, Kuziel WA, Rivest S, Owens T. Chemokine expression by glial cells directs leukocytes to sites of axonal injury in the CNS. J Neurosci. 2003;23:7922–7930. - PMC - PubMed
    1. Billings LM, Oddo S, Green KN, McGaugh JL, LaFerla FM. Intraneuronal Abeta causes the onset of early Alzheimer's disease-related cognitive deficits in transgenic mice. Neuron. 2005;45:675–688. - PubMed
    1. Boissonneault V, Filali M, Lessard M, Relton J, Wong G, Rivest S. Powerful beneficial effects of macrophage colony-stimulating factor on beta-amyloid deposition and cognitive impairment in Alzheimer's disease. Brain. 2009;132:1078–1092. - PubMed
    1. Bolmont T, Haiss F, Eicke D, Radde R, Mathis CA, Klunk WE, Kohsaka S, Jucker M, Calhoun ME. Dynamics of the microglial/amyloid interaction indicate a role in plaque maintenance. J Neurosci. 2008;28:4283–4292. - PMC - PubMed

Publication types

MeSH terms

Substances