. 2011 Jul;41(7):2010-20.
doi: 10.1002/eji.201041205.

TNF optimally activatives regulatory T cells by inducing TNF receptor superfamily members TNFR2, 4-1BB and OX40

Affiliations

TNF optimally activatives regulatory T cells by inducing TNF receptor superfamily members TNFR2, 4-1BB and OX40

Ryoko Hamano et al. Eur J Immunol. 2011 Jul.

Abstract

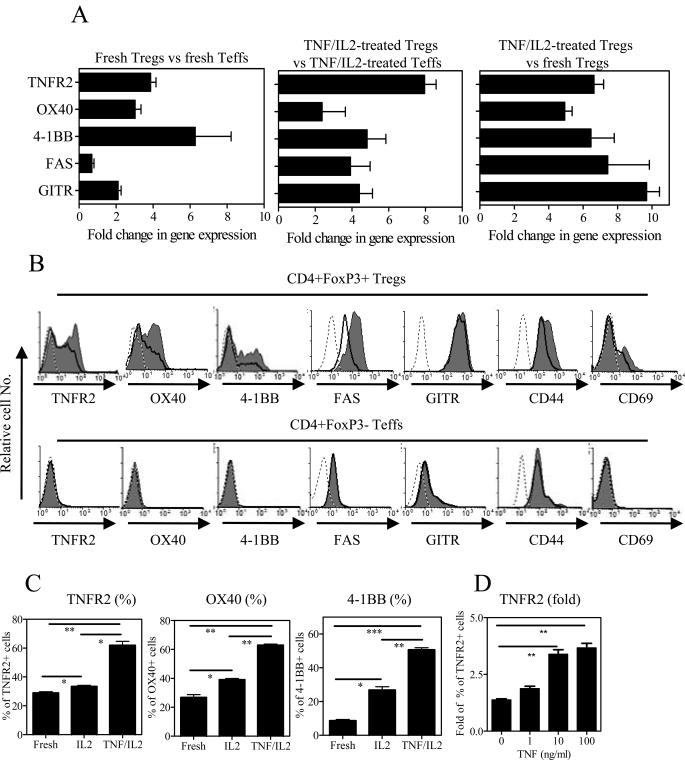
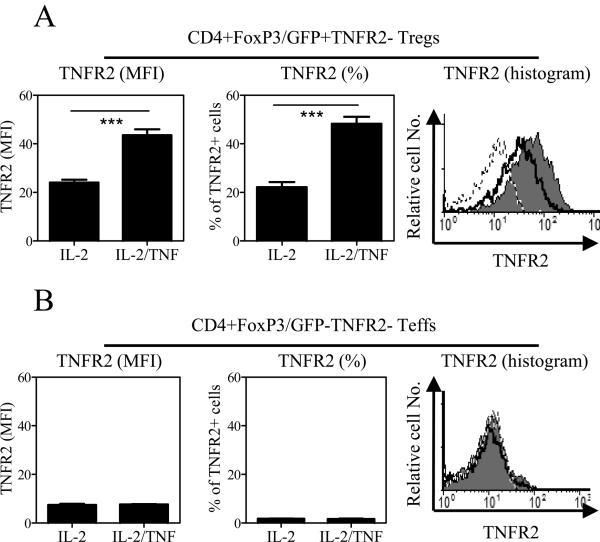
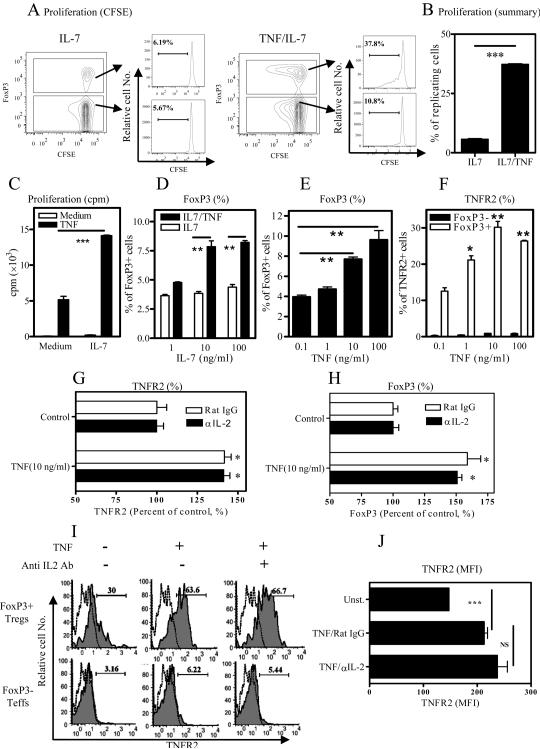
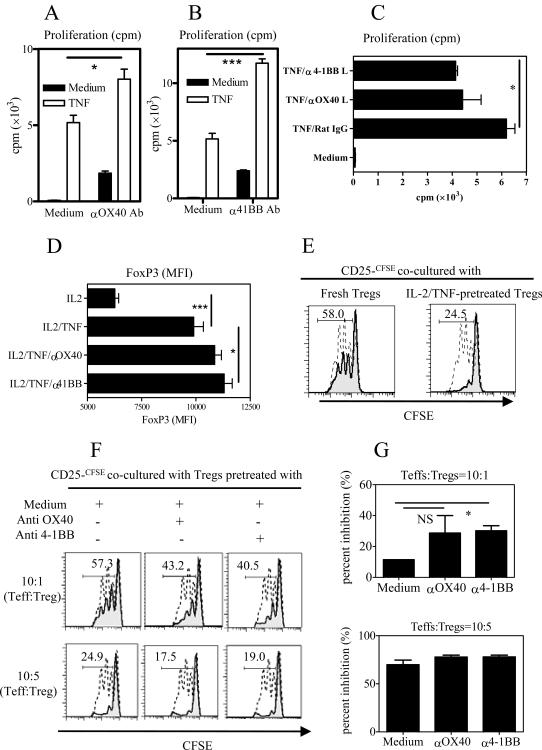
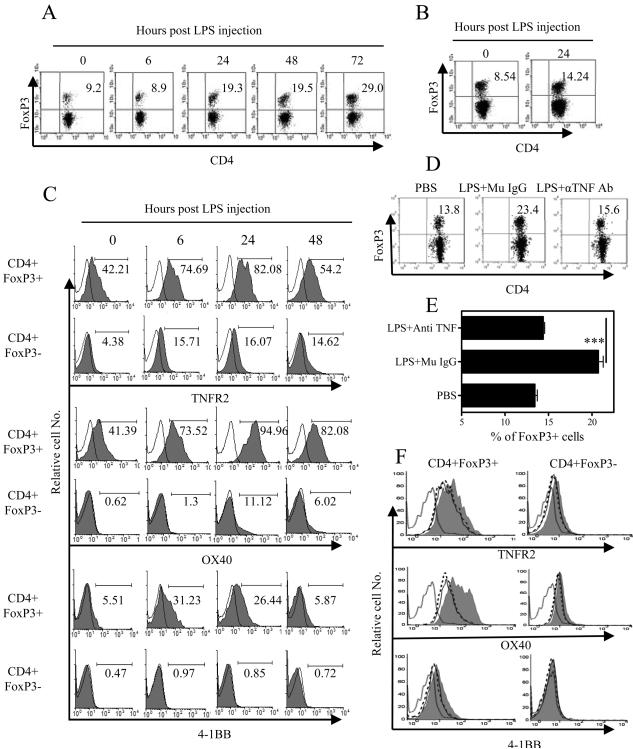
TNF is a pleiotropic cytokine with intriguing biphasic pro-inflammatory and anti-inflammatory effects. Our previous studies demonstrated that TNF up-regulated FoxP3 expression and activated and expanded CD4+ FoxP3+ regulatory T cells (Tregs) via TNFR2. Furthermore, TNFR2-expressing Tregs exhibited maximal suppressive activity. In this study, we show that TNF, in concert with IL-2, preferentially up-regulated mRNA and surface expression of TNFR2, 4-1BB and OX40 on Tregs. Agonistic antibodies against 4-1BB and OX40 also induced the proliferation of suppressive Tregs. Thus, TNF amplifies its stimulatory effect on Tregs by inducing TNF receptor superfamily (TNFRSF) members. In addition, administration of neutralizing anti-TNF Ab blocked LPS-induced expansion of splenic Tregs and up-regulation of TNFR2, OX40 and 4-1BB receptors on Tregs in vivo, indicating that the expansion of Tregs expressing these co-stimulatory TNFRSF members in response to LPS is mediated by TNF. Altogether, our novel data indicate that TNF preferentially up-regulates TNFR2 on Tregs, and this is amplified by the stimulation of 4-1BB and OX40, resulting in the optimal activation of Tregs and augmented attenuation of excessive inflammatory responses.


Figures

Figure 1
Figure 1
Up-regulation of genes and surface expression of co-stimulatory TNFRSF members on Tregs by TNF. (A) Flow-sorted CD4+FoxP3/gfp+ Tregs and CD4+FoxP3/gfp Teffs were cultured with TNF and IL-2 for 12 hours. RNA from freshly purified cells and TNF/IL-2-treated cells was isolated and gene expression of TNFRSF members was analyzed by real time PCR. Fold changes in gene expression between two indicated groups are shown. The data (means ± SEM, n=4) are summarized from four separate experiments with similar results. (B–D) CD4 cells were incubated with IL-2 or TNF/TNF for 3 days. The surface markers were analyzed with FACS by gating on FoxP3+ Tregs or FoxP3 Teffs. (B) Typical results of FACS analysis. Grey: TNF/IL-2; solid line: IL-2; dashed line: isotype control. (C) Summary of the percentage of TNFR2+, OX40+, and 4-1BB+ cells in Tregs. (D) In the presence of consistent concentration of IL-2, TNF up-regulated TNFR2 expression on FoxP3+ Tregs in a dose-dependent manner. Data shown are fold change in percentage of TNFR2+ Tregs over that of freshly isolated Tregs. Comparison of two indicated groups: *p<0.05, ** p<0.01, *** p<0.001. Data shown in C–D (means ± SEM, n=3) are representative of at least three separate experiments with similar results.
Figure 2
Figure 2
Induction of the expression of TNFR2 by IL-2 and TNF/IL-2 on FoxP3+TNFR2 Tregs. CD4+FoxP3/gfp+TNFR2 cells and CD4+FoxP3/gfpTNFR2 cells were flow-sorted. The cells were cultured with IL-2 or TNF/IL-2 for 3 days. The surface expression of TNFR2 was determined with FACS. Data (means ± SEM, n=3) in the left panel show the MFI of TNFR2 expression, and in the middle panel show the percentage of TNFR2+ cells. The comparison of IL-2 and TNF/IL-2: *** p<0.001. Data in the right panel show results of a representative FACS analysis. Grey: TNF/IL-2; solid line: IL-2 alone; dashed line: isotype control. Data shown are representative of three separate experiments with similar results.
Figure 3
Figure 3
Stimulation of Tregs in the presence of IL-7 by TNF. (A–B) CD4 cells were labeled with CFSE and cultured with IL-7, in the absence or presence of TNF. After 3 days, the cell replication, as shown by dilution of CFSE, on Tregs and Teffs was analyzed with FACS, by gating on FoxP3+ or FoxP3 cells respectively. Representative data from at least three separate experiments with similar results are shown in (A). The summary of replication of Tregs is shown in (B). (C) Flow-sorted CD4+FoxP3/gfp+ T cells were stimulated with APCs and anti-CD3, in the presence of medium, or IL-7, or TNF, or TNF/IL-7. After 72-hour incubation, cell proliferation was determined by [3]H thymidine incorporation assay. (D–E) CD4 cells were cultured with increasing concentrations of IL-7 alone or with consistent concentration of TNF (D), or cultured with consistent concentration of IL-7 and increasing concentrations of TNF (E), for 3 days. The proportion of FoxP3+ cells was analyzed by FACS. Open bar: IL-7 alone; black bar: TNF/IL-7 (D). (B–E): ** p<0.01, *** p<0.0001, as compared with indicated group. (F) CD4 cells were cultured same as (D). The proportion of TNFR2+ cells was analyzed with FACS by gating on FoxP3+ cells or FoxP3 cells. Black bar: FoxP3 cells; open bar: FoxP3+ cells. *p<0.05; ** p<0.01, as compared with lowest dose of TNF (0.1 ng/ml) (G–H) CD4 cells were cultured with IL-7 plus 0.1 ng/ml of TNF as control or 10 ng/ml of TNF, with Rat IgG (open bar) or neutralizing anti-IL-2 Ab (black bar). The proportion of TNFR2 (G) or FoxP3 (H) expression on Tregs was analyzed with FACS by gating on FoxP3+ cells. Data shown are percentage of control (%). Comparison with respective control, * p<0.05. (I–J) CD4 cells were cultured with TNF alone, with or without neutralizing anti-IL-2 Ab, for 24 hours. The expression of TNFR2 was analyzed with FACS, by gating on FoxP3+ cells or FoxP3 cells. A representative FACS analysis was shown in (I). Solid line: TNFR2; dashed line: isotype. Number in the histogram indicates percentage of TNFR2+ cells (%). MFI of TNFR2 expression on FoxP3+ cells was shown in (J). Comparison of indicated two groups, *** p<0.001. NS: no statistical significance. Data in (B–H, J) are means ± SEM (N=3). Data shown are representatives of at least three separate experiments with similar results.
Figure 4
Figure 4
Activation of 4-1BB and OX40 expands potent suppressive Tregs. (A–B) Flow-sorted CD4+FoxP3/gfp+ Tregs were stimulated with APCs and anti-CD3, with or without TNF, or with agonistic anti-OX40 Ab, A) or with agonistic anti-4-1BB Ab (B). After 72-hr incubation, proliferation was determined by [3]H thymidine incorporation assay. (C) CD4+FoxP3/gfp+ Tregs were stimulated with APCs and anti-CD3, with medium, or with TNF, or TNF plus blocking anti-OX40 L Ab or anti-4-1BB L Ab. After 72-hr incubation, proliferation was determined by [3]H thymidine incorporation assay. (C) Flow-sorted CD4+FoxP3/gfp+ Tregs were cultured with IL-2 with or without TNF, or TNF plus agonistic anti-OX40 Ab, or anti-4-1BB Ab. After 3 days, MFI of FoxP3 expression was analyzed with FACS. Data (means ± SEM, n=3) shown in (A~D) are representative of three experiments with similar results. The comparison of two indicated groups, * p<0.05; *** p<0.001. (E) Flow-sorted CD4+CD25+ Tregs were treated with medium which contained TNF/IL-2 for 3 days. After washing, pre-treated Tregs or freshly FACS-purified CD4+CD25+ Tregs were added into the freshly flow-sorted, CFSE-labeled CD4+CD25 T cells at 10:5 ration (Teff:Treg). (F) Flow-sorted CD4+CD25+ Tregs were treated with medium which contained TNF/IL-2, with or without agonistic anti-4-1BB Ab or anti-OX40 Ab for 3 days. After washing, pre-treated Tregs were added into the freshly flow-sorted, CFSE-labeled CD4+CD25 Teffs at 10:1 and 10:5 ration (Teff:Treg). The cells were stimulated with APCs and anti-CD3 Ab. After 48-hr incubation, the proliferation was measured by CFSE dilution on Teffs with FACS. Dashed histogram: CFSE expression profile of Teffs alone; grey histogram: CFSE expression profile of Teffs co-cultured with Tregs. The number in the histogram stands for the proportion of CFSE-diluted cells in the presence of Tregs (%). Data shown are representatives of three separate experiments with similar results. (G) The summary of percent inhibition exerted by Tregs pretreated with medium alone (with TNF/IL-2) or with medium plus agonistic anti-OX40 Ab or anti-4-1BB Ab. Data shown (means ± SEM, n=6) were summarized from two separate experiments with similar results. Comparison with indicated two groups: *p<0.05. N.S., no statistical significance.
Figure 5
Figure 5
Neutralizing anti-TNF Ab blocked LPS-induced the expansion of Tregs and up-regulation of TNFRSFs on Tregs. Normal B6 mice were injected with 200 μg of LPS (i.p.) or PBS. Mouse spleens and mesenteric LNs were harvested at indicated time after injection. The proportion of FoxP3+ cells present in the spleen (A) or mesenteric LNs (B) was analyzed with FACS, by gating on CD4+ T cells. (C) Expression of TNFR2, OX40 and 4-1BB on Tregs or Teffs present in the spleen was analyzed with FACS, by gating on CD4+FoxP3+ cells or CD4+FoxP3 cells. (D~F) Mice were i.p. injected with 200 μg of neutralizing anti-mouse TNF Ab (5E5) or control mouse IgG1 24 hrs and 1 hr before challenge of 200 μg of LPS or PBS (i.p.). On day 5 after LPS injection, the proportion of FoxP3+ cells was analyzed with FACS, by gating on CD4+ T cells. (D) Typical dot plot of FACS analysis. (E) The summary of percentage of FoxP3+ cells in splenic CD4 subset (means ± SEM, n=5). Comparison of indicated two groups, *** p<0.001. (F) Expression of TNFR2, OX40 (24 hrs after LPS injection) and 4-1BB (6 hrs after LPS injection) was analyzed with FACS, by gating on FoxP3+ and FoxP3 CD4 cells. Grey: LPS treatment; solid line: LPS and anti-TNF Ab treatment; dashed line, PBS control; dotted line: isotype control. The number in the dot plot indicates the percentage of cells in the respective quadrants (%). The number in the histogram indicates the percentage of positive cells (%). Data shown are representative of three separate experiments with similar results.

Similar articles

Cited by

References

    1. Wing K, Sakaguchi S. Regulatory T cells exert checks and balances on self tolerance and autoimmunity. Nat Immunol. 2010;11:7–13. - PubMed
    1. Shevach EM. Mechanisms of foxp3+ T regulatory cell-mediated suppression. Immunity. 2009;30:636–645. - PubMed
    1. Chen X, Baumel M, Mannel DN, Howard OM, Oppenheim JJ. Interaction of TNF with TNF receptor type 2 promotes expansion and function of mouse CD4+CD25+ T regulatory cells. J Immunol. 2007;179:154–161. - PubMed
    1. Chen X, Subleski JJ, Hamano R, Howard OM, Wiltrout RH, Oppenheim JJ. Co-expression of TNFR2 and CD25 identifies more of the functional CD4+FOXP3+ regulatory T cells in human peripheral blood. Eur J Immunol. 2010;40:1099–1106. - PMC - PubMed
    1. Chen X, Subleski JJ, Kopf H, Howard OM, Mannel DN, Oppenheim JJ. Cutting edge: expression of TNFR2 defines a maximally suppressive subset of mouse CD4+CD25+FoxP3+ T regulatory cells: applicability to tumor-infiltrating T regulatory cells. J Immunol. 2008;180:6467–6471. - PMC - PubMed

Publication types

MeSH terms

LinkOut - more resources