

Beyond the random coil: stochastic conformational switching in intrinsically disordered proteins
- PMID: 21481779
- PMCID: PMC3075556
- DOI: 10.1016/j.str.2011.01.011
Beyond the random coil: stochastic conformational switching in intrinsically disordered proteins
Abstract
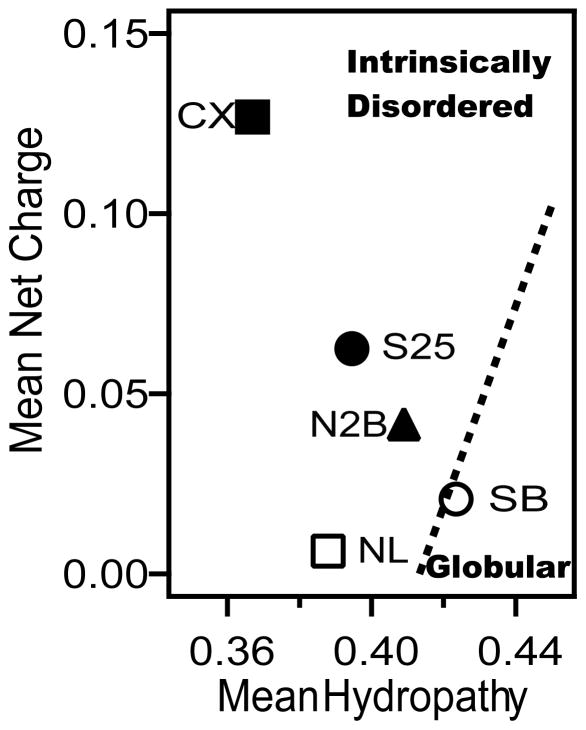
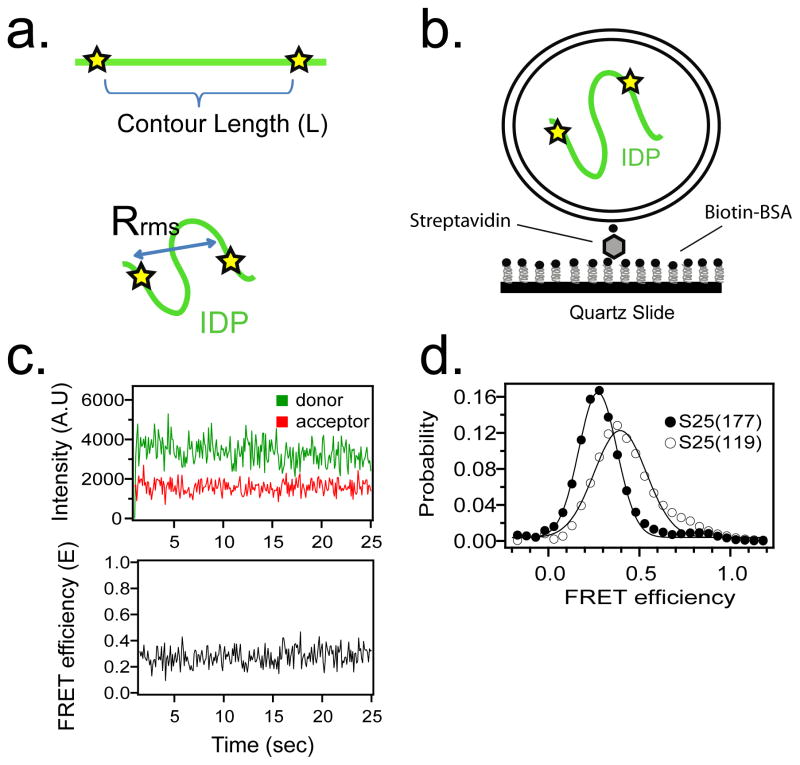
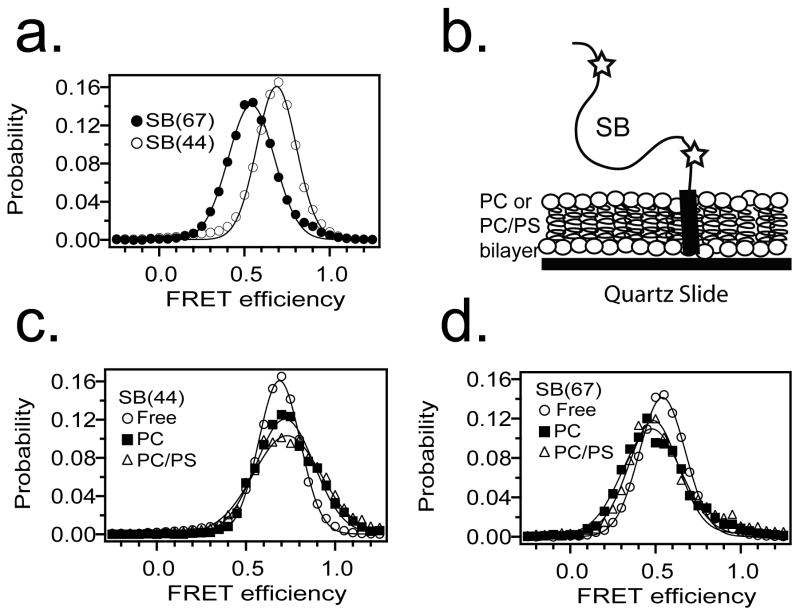
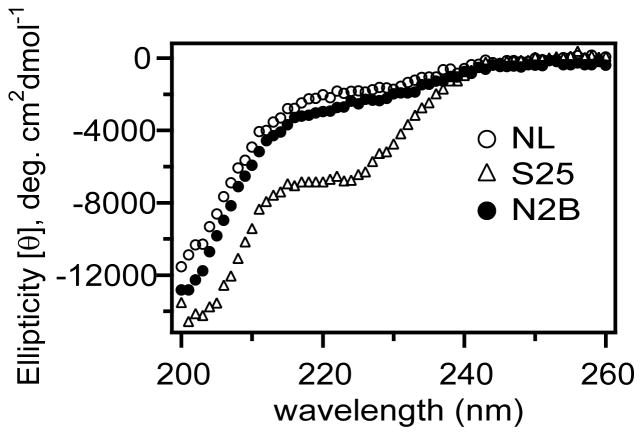
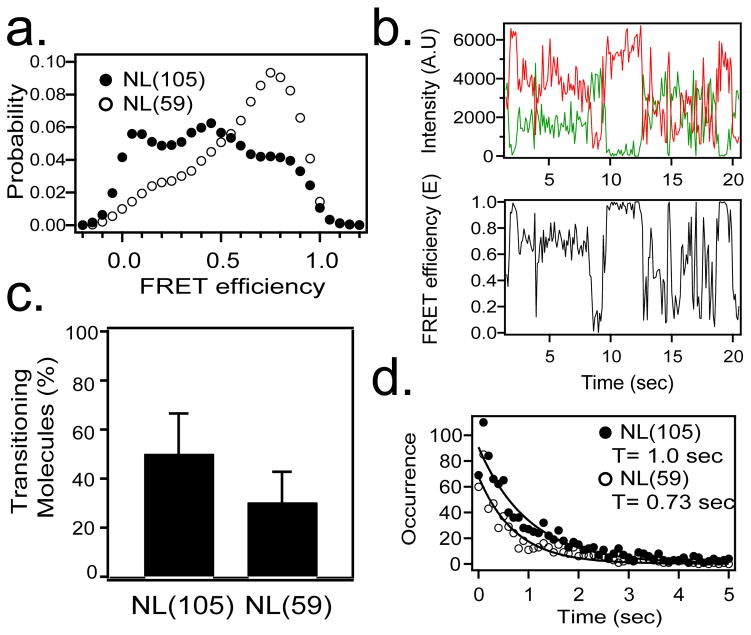
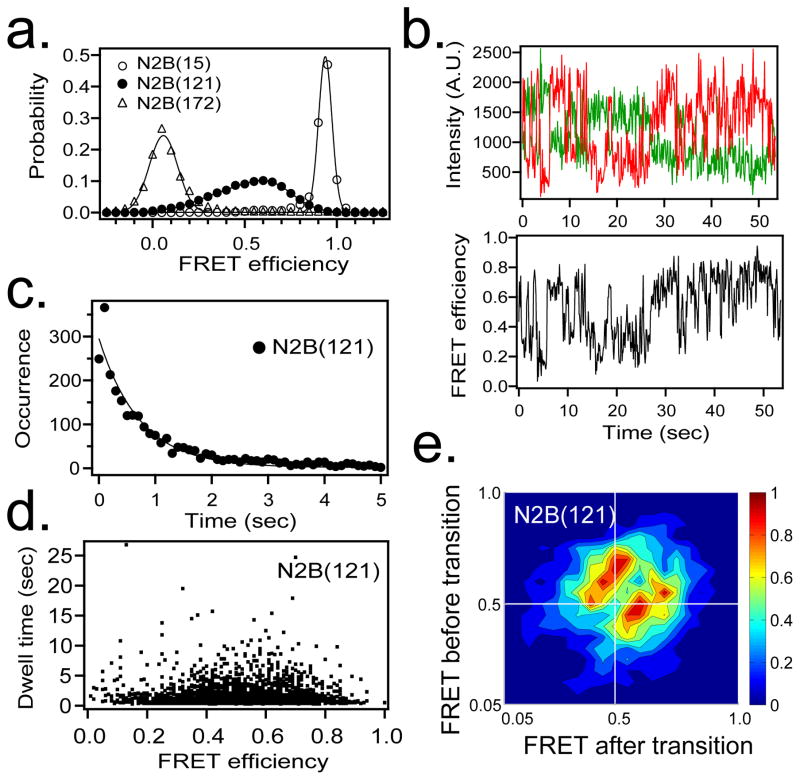
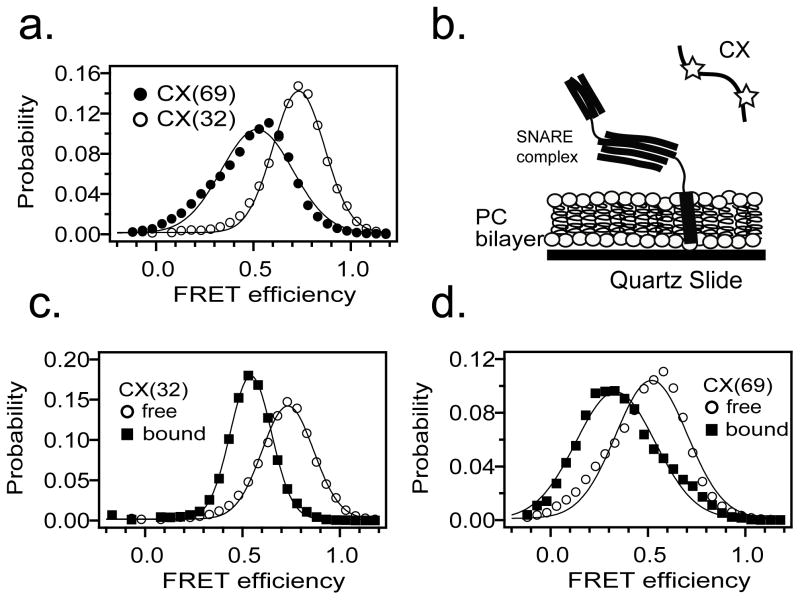
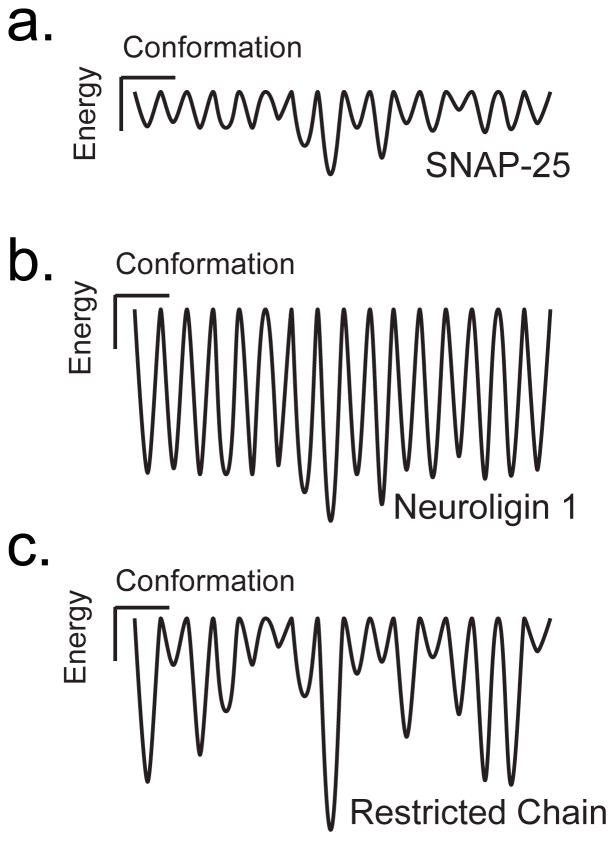
Intrinsically disordered proteins (IDPs) participate in critical cellular functions that exploit the flexibility and rapid conformational fluctuations of their native state. Limited information about the native state of IDPs can be gained by the averaging over many heterogeneous molecules that is unavoidable in ensemble approaches. We used single molecule fluorescence to characterize native state conformational dynamics in five synaptic proteins confirmed to be disordered by other techniques. For three of the proteins, SNAP-25, synaptobrevin and complexin, their conformational dynamics could be described with a simple semiflexible polymer model. Surprisingly, two proteins, neuroligin and the NMDAR-2B glutamate receptor, were observed to stochastically switch among distinct conformational states despite the fact that they appeared intrinsically disordered by other measures. The hop-like intramolecular diffusion found in these proteins is suggested to define a class of functionality previously unrecognized for IDPs.
Copyright © 2011 Elsevier Ltd. All rights reserved.
Figures

Similar articles
-
Complexin induces a conformational change at the membrane-proximal C-terminal end of the SNARE complex.Elife. 2016 Jun 2;5:e16886. doi: 10.7554/eLife.16886. Elife. 2016. PMID: 27253060 Free PMC article.
-
Single-molecule studies of synaptotagmin and complexin binding to the SNARE complex.Biophys J. 2005 Jul;89(1):690-702. doi: 10.1529/biophysj.104.054064. Epub 2005 Apr 8. Biophys J. 2005. PMID: 15821166 Free PMC article.
-
Multiple factors maintain assembled trans-SNARE complexes in the presence of NSF and αSNAP.Elife. 2019 Jan 18;8:e38880. doi: 10.7554/eLife.38880. Elife. 2019. PMID: 30657450 Free PMC article.
-
Spontaneous Switching among Conformational Ensembles in Intrinsically Disordered Proteins.Biomolecules. 2019 Mar 22;9(3):114. doi: 10.3390/biom9030114. Biomolecules. 2019. PMID: 30909517 Free PMC article. Review.
-
Understanding disordered and unfolded proteins using single-molecule FRET and polymer theory.Methods Appl Fluoresc. 2016 Nov 17;4(4):042003. doi: 10.1088/2050-6120/4/4/042003. Methods Appl Fluoresc. 2016. PMID: 28192291 Review.
Cited by
-
Re-visiting the trans insertion model for complexin clamping.Elife. 2015 Apr 2;4:e04463. doi: 10.7554/eLife.04463. Elife. 2015. PMID: 25831964 Free PMC article.
-
Non-ionotropic signaling by the NMDA receptor: controversy and opportunity.F1000Res. 2016 May 26;5:F1000 Faculty Rev-1010. doi: 10.12688/f1000research.8366.1. eCollection 2016. F1000Res. 2016. PMID: 27303637 Free PMC article. Review.
-
A multiepitope vaccine encoding four Eimeria epitopes with PLGA nanospheres: a novel vaccine candidate against coccidiosis in laying chickens.Vet Res. 2022 Apr 1;53(1):27. doi: 10.1186/s13567-022-01045-w. Vet Res. 2022. PMID: 35365221 Free PMC article.
-
'RNA modulation of transport properties and stability in phase-separated condensates.Biophys J. 2021 Dec 7;120(23):5169-5186. doi: 10.1016/j.bpj.2021.11.003. Epub 2021 Nov 9. Biophys J. 2021. PMID: 34762868 Free PMC article.
-
Single-molecule fluorescence studies of intrinsically disordered proteins and liquid phase separation.Biochim Biophys Acta Proteins Proteom. 2019 Oct;1867(10):980-987. doi: 10.1016/j.bbapap.2019.04.007. Epub 2019 May 2. Biochim Biophys Acta Proteins Proteom. 2019. PMID: 31054969 Free PMC article. Review.
References
-
- Boukobza E, Sonnenfeld A, Haran G. Immobilization in surface-tethered lipid vesicles as a new tool for single biomolecule spectroscopy. Journal of Physical Chemistry B. 2001;105:12165–12170.
-
- Brunger AT. Structure and function of SNARE and SNARE-interacting proteins. Q Rev Biophys. 2005;38:1–47. - PubMed
Publication types
MeSH terms
Substances
Grants and funding
LinkOut - more resources
Full Text Sources
