Trans-endocytosis of CD80 and CD86: a molecular basis for the cell-extrinsic function of CTLA-4
- PMID: 21474713
- PMCID: PMC3198051
- DOI: 10.1126/science.1202947
Trans-endocytosis of CD80 and CD86: a molecular basis for the cell-extrinsic function of CTLA-4
Abstract
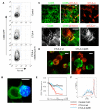
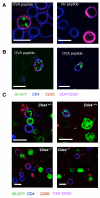
Cytotoxic T lymphocyte antigen 4 (CTLA-4) is an essential negative regulator of T cell immune responses whose mechanism of action is the subject of debate. CTLA-4 shares two ligands (CD80 and CD86) with a stimulatory receptor, CD28. Here, we show that CTLA-4 can capture its ligands from opposing cells by a process of trans-endocytosis. After removal, these costimulatory ligands are degraded inside CTLA-4-expressing cells, resulting in impaired costimulation via CD28. Acquisition of CD86 from antigen-presenting cells is stimulated by T cell receptor engagement and observed in vitro and in vivo. These data reveal a mechanism of immune regulation in which CTLA-4 acts as an effector molecule to inhibit CD28 costimulation by the cell-extrinsic depletion of ligands, accounting for many of the known features of the CD28-CTLA-4 system.
Figures


Comment in
-
Immunology. Damping by depletion.Science. 2011 Apr 29;332(6029):542-3. doi: 10.1126/science.1206122. Science. 2011. PMID: 21527700 No abstract available.
Similar articles
-
CTLA-4Ig: uses and future directions.Recent Pat Inflamm Allergy Drug Discov. 2009 Jun;3(2):132-42. doi: 10.2174/187221309788489760. Recent Pat Inflamm Allergy Drug Discov. 2009. PMID: 19519590
-
Targeting CD28, CTLA-4 and PD-L1 costimulation differentially controls immune synapses and function of human regulatory and conventional T-cells.PLoS One. 2013 Dec 23;8(12):e83139. doi: 10.1371/journal.pone.0083139. eCollection 2013. PLoS One. 2013. PMID: 24376655 Free PMC article.
-
Preferential costimulation by CD80 results in IL-10-dependent TGF-beta1(+) -adaptive regulatory T cell generation.J Immunol. 2008 May 15;180(10):6566-76. doi: 10.4049/jimmunol.180.10.6566. J Immunol. 2008. PMID: 18453575 Free PMC article.
-
Molecular and Cellular Functions of CTLA-4.Adv Exp Med Biol. 2020;1248:7-32. doi: 10.1007/978-981-15-3266-5_2. Adv Exp Med Biol. 2020. PMID: 32185705 Review.
-
Targeting T cell costimulation in autoimmune disease.Expert Opin Ther Targets. 2002 Jun;6(3):275-89. doi: 10.1517/14728222.6.3.275. Expert Opin Ther Targets. 2002. PMID: 12223069 Review.
Cited by
-
Mechanisms of action of therapeutic antibodies for cancer.Mol Immunol. 2015 Oct;67(2 Pt A):28-45. doi: 10.1016/j.molimm.2015.04.002. Epub 2015 Apr 23. Mol Immunol. 2015. PMID: 25911943 Free PMC article. Review.
-
Biomechanics of T Cell Dysfunctions in Chronic Diseases.Front Immunol. 2021 Feb 25;12:600829. doi: 10.3389/fimmu.2021.600829. eCollection 2021. Front Immunol. 2021. PMID: 33717081 Free PMC article. Review.
-
Impaired dendritic cell function in a spontaneous autoimmune polyneuropathy.J Immunol. 2015 May 1;194(9):4175-84. doi: 10.4049/jimmunol.1401766. Epub 2015 Mar 30. J Immunol. 2015. PMID: 25825437 Free PMC article.
-
Antigen choice determines vaccine-induced generation of immunogenic versus tolerogenic dendritic cells that are marked by differential expression of pancreatic enzymes.J Immunol. 2013 Apr 1;190(7):3319-27. doi: 10.4049/jimmunol.1203321. Epub 2013 Feb 18. J Immunol. 2013. PMID: 23420890 Free PMC article.
-
Regulatory T cell induction, migration, and function in transplantation.J Immunol. 2012 Nov 15;189(10):4705-11. doi: 10.4049/jimmunol.1202027. J Immunol. 2012. PMID: 23125426 Free PMC article. Review.
References
Publication types
MeSH terms
Substances
Grants and funding
- BB/H013598/1/BB_/Biotechnology and Biological Sciences Research Council/United Kingdom
- 17851/ARC_/Arthritis Research UK/United Kingdom
- G0400931/MRC_/Medical Research Council/United Kingdom
- BB/D011000/1/BB_/Biotechnology and Biological Sciences Research Council/United Kingdom
- G0401620/MRC_/Medical Research Council/United Kingdom
LinkOut - more resources
Full Text Sources
Other Literature Sources
Molecular Biology Databases

