Subtypes of pancreatic ductal adenocarcinoma and their differing responses to therapy
- PMID: 21460848
- PMCID: PMC3755490
- DOI: 10.1038/nm.2344
Subtypes of pancreatic ductal adenocarcinoma and their differing responses to therapy
Abstract
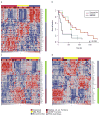
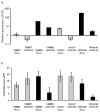
Pancreatic ductal adenocarcinoma (PDA) is a lethal disease. Overall survival is typically 6 months from diagnosis. Numerous phase 3 trials of agents effective in other malignancies have failed to benefit unselected PDA populations, although patients do occasionally respond. Studies in other solid tumors have shown that heterogeneity in response is determined, in part, by molecular differences between tumors. Furthermore, treatment outcomes are improved by targeting drugs to tumor subtypes in which they are selectively effective, with breast and lung cancers providing recent examples. Identification of PDA molecular subtypes has been frustrated by a paucity of tumor specimens available for study. We have overcome this problem by combined analysis of transcriptional profiles of primary PDA samples from several studies, along with human and mouse PDA cell lines. We define three PDA subtypes: classical, quasimesenchymal and exocrine-like, and we present evidence for clinical outcome and therapeutic response differences between them. We further define gene signatures for these subtypes that may have utility in stratifying patients for treatment and present preclinical model systems that may be used to identify new subtype specific therapies.
Figures


Similar articles
-
A rapid in vivo screen for pancreatic ductal adenocarcinoma therapeutics.Dis Model Mech. 2015 Oct 1;8(10):1201-11. doi: 10.1242/dmm.020933. Dis Model Mech. 2015. PMID: 26438693 Free PMC article.
-
KRAS mutation in metastatic pancreatic ductal adenocarcinoma: results of a multicenter phase II study evaluating efficacy of cetuximab plus gemcitabine/oxaliplatin (GEMOXCET) in first-line therapy.Oncology. 2011;81(1):3-8. doi: 10.1159/000330194. Epub 2011 Sep 2. Oncology. 2011. PMID: 21894049 Clinical Trial.
-
Synergistic effect between erlotinib and MEK inhibitors in KRAS wild-type human pancreatic cancer cells.Clin Cancer Res. 2011 May 1;17(9):2744-56. doi: 10.1158/1078-0432.CCR-10-2214. Epub 2011 Mar 8. Clin Cancer Res. 2011. PMID: 21385921 Free PMC article.
-
New biomarkers and targets in pancreatic cancer and their application to treatment.Nat Rev Gastroenterol Hepatol. 2012 Aug;9(8):435-44. doi: 10.1038/nrgastro.2012.119. Epub 2012 Jun 26. Nat Rev Gastroenterol Hepatol. 2012. PMID: 22733351 Review.
-
Gemcitabine resistance in pancreatic ductal adenocarcinoma.Drug Resist Updat. 2015 Nov;23:55-68. doi: 10.1016/j.drup.2015.10.002. Epub 2015 Nov 3. Drug Resist Updat. 2015. PMID: 26690340 Review.
Cited by
-
Head and neck cancer subtypes with biological and clinical relevance: Meta-analysis of gene-expression data.Oncotarget. 2015 Apr 20;6(11):9627-42. doi: 10.18632/oncotarget.3301. Oncotarget. 2015. PMID: 25821127 Free PMC article.
-
Cholesterol Pathway Inhibition Induces TGF-β Signaling to Promote Basal Differentiation in Pancreatic Cancer.Cancer Cell. 2020 Oct 12;38(4):567-583.e11. doi: 10.1016/j.ccell.2020.08.015. Epub 2020 Sep 24. Cancer Cell. 2020. PMID: 32976774 Free PMC article.
-
Advanced-stage pancreatic cancer: therapy options.Nat Rev Clin Oncol. 2013 Jun;10(6):323-33. doi: 10.1038/nrclinonc.2013.66. Epub 2013 Apr 30. Nat Rev Clin Oncol. 2013. PMID: 23629472 Review.
-
Proteogenomic insights into the biology and treatment of pancreatic ductal adenocarcinoma.J Hematol Oncol. 2022 Nov 25;15(1):168. doi: 10.1186/s13045-022-01384-3. J Hematol Oncol. 2022. PMID: 36434634 Free PMC article.
-
Pancreatic cancer tumor organoids exhibit subtype-specific differences in metabolic profiles.Cancer Metab. 2024 Oct 3;12(1):28. doi: 10.1186/s40170-024-00357-z. Cancer Metab. 2024. PMID: 39363341 Free PMC article.
References
-
- Stathis A, Moore MJ. Advanced pancreatic carcinoma: current treatment and future challenges. Nat Rev Clin Oncol. 2010;7:163–172. - PubMed
-
- Slamon DJ, et al. Use of chemotherapy plus a monoclonal antibody against HER2 for metastatic breast cancer that overexpresses HER2. N Engl J Med. 2001;344:783–792. - PubMed
-
- Lynch TJ, et al. Activating mutations in the epidermal growth factor receptor underlying responsiveness of non-small-cell lung cancer to gefitinib. N Engl J Med. 2004;350:2129–2139. - PubMed
-
- Alizadeh AA, et al. Distinct types of diffuse large B-cell lymphoma identified by gene expression profiling. Nature. 2000;403:503–511. - PubMed
-
- Badea L, Herlea V, Dima SO, Dumitrascu T, Popescu I. Combined gene expression analysis of whole-tissue and microdissected pancreatic ductal adenocarcinoma identifies genes specifically overexpressed in tumor epithelia. Hepatogastroenterology. 2008;55:2016–2027. - PubMed
Publication types
MeSH terms
Substances
Grants and funding
LinkOut - more resources
Full Text Sources
Other Literature Sources
Medical
Molecular Biology Databases
Miscellaneous

