On the origin of DNA genomes: evolution of the division of labor between template and catalyst in model replicator systems
- PMID: 21455287
- PMCID: PMC3063752
- DOI: 10.1371/journal.pcbi.1002024
On the origin of DNA genomes: evolution of the division of labor between template and catalyst in model replicator systems
Abstract
The division of labor between template and catalyst is a fundamental property of all living systems: DNA stores genetic information whereas proteins function as catalysts. The RNA world hypothesis, however, posits that, at the earlier stages of evolution, RNA acted as both template and catalyst. Why would such division of labor evolve in the RNA world? We investigated the evolution of DNA-like molecules, i.e. molecules that can function only as template, in minimal computational models of RNA replicator systems. In the models, RNA can function as both template-directed polymerase and template, whereas DNA can function only as template. Two classes of models were explored. In the surface models, replicators are attached to surfaces with finite diffusion. In the compartment models, replicators are compartmentalized by vesicle-like boundaries. Both models displayed the evolution of DNA and the ensuing division of labor between templates and catalysts. In the surface model, DNA provides the advantage of greater resistance against parasitic templates. However, this advantage is at least partially offset by the disadvantage of slower multiplication due to the increased complexity of the replication cycle. In the compartment model, DNA can significantly delay the intra-compartment evolution of RNA towards catalytic deterioration. These results are explained in terms of the trade-off between template and catalyst that is inherent in RNA-only replication cycles: DNA releases RNA from this trade-off by making it unnecessary for RNA to serve as template and so rendering the system more resistant against evolving parasitism. Our analysis of these simple models suggests that the lack of catalytic activity in DNA by itself can generate a sufficient selective advantage for RNA replicator systems to produce DNA. Given the widespread notion that DNA evolved owing to its superior chemical properties as a template, this study offers a novel insight into the evolutionary origin of DNA.
Conflict of interest statement
The authors have declared that no competing interests exist.
Figures


 ).
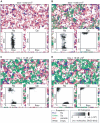
After the system reached evolutionary equilibrium (panel A), the
mutation was enabled (
 ), and
the resulting evolutionary dynamics are depicted in panel B to D.
The larger panels depict snapshots of simulations taken at different
times as indicated above panels. The color coding is indicated at
the bottom of the figure. RNA and DNA are not distinguished. The
timescale is scaled such that it has the same meaning as that of the
ordinary differential equation model that describes the replicator
dynamics with the same rate constants as in the CA model (the
timescale is scaled in this manner throughout the paper). The
smaller panels within the larger panels depict a two-dimensional
histogram of
  and
and
 . See
the main text for the description for each panel. The parameters
(rate constants) used in this simulation were as follows:
 (replication);
  (decay);
  (diffusion);
  (parasite advantage);
  (mutation rate of
  and
and
 );
);
 (mutation step);
  (mutation rate from Rp to Dp);
  (mutation rate to parasites). The size of CA was 1024×1024
squares. The boundary had no flux.
 ). The
color coding is indicated in the figure. The parameters were as
follows:
  and
and
 for
both Rp and Dp;
  ;
;
 ; the
size of CA was 512×512 squares; the other parameters were the
same as in Figure
2.
 ; the
size of CA was 512×512 squares; the other parameters were the
same as in Figure
2.
 ). The
format of the figure is the same as that of Figure 2. For the explanation of
each panel, see the main text. The parameters were as follows:
 ; the
size of CA is 512×512 squares; the other parameters were the
same as in Figure
2.

 ).
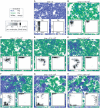
After the system reached evolutionary equilibrium (Figure 7A), the
mutation (
 ) was
enabled. The resulting evolutionary dynamics are depicted in panel B
to E. The left picture of each panel shows a snapshot of the
simulation taken at different times as indicated above panels. The
color coding is indicated in the upper left corner of the figure.
DNA and RNA are not distinguished. The insets depict two-dimensional
histogram of
  and
and
 . The
right picture of each panel shows a snapshot with a different color
coding, which indicates the value of
  .
Distinction is not made between Dp and Rp and between DNA and RNA.
The insets depict a histogram of
  with
the same color coding as in the larger pictures that contain them.
For the explanation of each panel, see the main text. The parameters
were as follows:
  (the
volume threshold for division of compartments);
 (the
target volume is set to the number of internal replicators
multiplied by
  );
);
 ; the
size of the CA is 512×512 squares; the other parameters were
the same as in Figure
2.

 (effectively); the size of the CA is
512×512 squares; the other parameters were the same as in
Figure
2.
(effectively); the size of the CA is
512×512 squares; the other parameters were the same as in
Figure
2.Similar articles
-
Evolution of the division of labour between templates and catalysts in spatial replicator models.J Evol Biol. 2024 Oct 10;37(10):1158-1169. doi: 10.1093/jeb/voae098. J Evol Biol. 2024. PMID: 39120521
-
The evolution of strand preference in simulated RNA replicators with strand displacement: implications for the origin of transcription.Biol Direct. 2008 Aug 11;3:33. doi: 10.1186/1745-6150-3-33. Biol Direct. 2008. PMID: 18694481 Free PMC article.
-
Evolution of the division of labor between genes and enzymes in the RNA world.PLoS Comput Biol. 2014 Dec 4;10(12):e1003936. doi: 10.1371/journal.pcbi.1003936. eCollection 2014 Dec. PLoS Comput Biol. 2014. PMID: 25474573 Free PMC article.
-
Metabolically Coupled Replicator Systems: Overview of an RNA-world model concept of prebiotic evolution on mineral surfaces.J Theor Biol. 2015 Sep 21;381:39-54. doi: 10.1016/j.jtbi.2015.06.002. Epub 2015 Jun 15. J Theor Biol. 2015. PMID: 26087284 Review.
-
Ecology and Evolution in the RNA World Dynamics and Stability of Prebiotic Replicator Systems.Life (Basel). 2017 Nov 27;7(4):48. doi: 10.3390/life7040048. Life (Basel). 2017. PMID: 29186916 Free PMC article. Review.
Cited by
-
Rolling Circles as a Means of Encoding Genes in the RNA World.Life (Basel). 2022 Sep 2;12(9):1373. doi: 10.3390/life12091373. Life (Basel). 2022. PMID: 36143408 Free PMC article.
-
Evolutionary dynamics of RNA-like replicator systems: A bioinformatic approach to the origin of life.Phys Life Rev. 2012 Sep;9(3):219-63. doi: 10.1016/j.plrev.2012.06.001. Epub 2012 Jun 13. Phys Life Rev. 2012. PMID: 22727399 Free PMC article. Review.
-
Circularity and self-cleavage as a strategy for the emergence of a chromosome in the RNA-based protocell.Biol Direct. 2013 Aug 23;8:21. doi: 10.1186/1745-6150-8-21. Biol Direct. 2013. PMID: 23971788 Free PMC article.
-
Inevitability of the emergence and persistence of genetic parasites caused by evolutionary instability of parasite-free states.Biol Direct. 2017 Dec 4;12(1):31. doi: 10.1186/s13062-017-0202-5. Biol Direct. 2017. PMID: 29202832 Free PMC article.
-
Parasites Sustain and Enhance RNA-Like Replicators through Spatial Self-Organisation.PLoS Comput Biol. 2016 Apr 27;12(4):e1004902. doi: 10.1371/journal.pcbi.1004902. eCollection 2016 Apr. PLoS Comput Biol. 2016. PMID: 27120344 Free PMC article.
References
-
- Woese CR. The Genetic Code: the Molecular Basis for Genetic Expression. New York: Harper & Row; 1967. 200
-
- Gesteland RF, Cech T, Atkins JF. The RNA world. Cold Spring Harbor, N.Y.: Cold Spring Harbor Laboratory Press; 2006. 768
-
- Gilbert W. Origin of life—the RNA world. Nature. 1986;319:618–618.
-
- Crick FH. The origin of the genetic code. J Mol Biol. 1968;38:367–379. - PubMed
-
- Orgel LE. Evolution of the genetic apparatus. J Mol Biol. 1968;38:381–393. - PubMed
Publication types
MeSH terms
Substances
Grants and funding
LinkOut - more resources
Full Text Sources

