. 2011 May;7(5):278-84.
doi: 10.1038/nchembio.545. Epub 2011 Mar 27.

Retromer terminates the generation of cAMP by internalized PTH receptors

Affiliations

Retromer terminates the generation of cAMP by internalized PTH receptors

Timothy N Feinstein et al. Nat Chem Biol. 2011 May.

Abstract

The generation of cAMP by G protein-coupled receptors (GPCRs) and its termination are currently thought to occur exclusively at the plasma membrane of cells. Under existing models of receptor regulation, this signal is primarily restricted by desensitization of the receptors through their binding to β-arrestins. However, this paradigm is not consistent with recent observations that the parathyroid hormone receptor type 1 (PTHR) continues to stimulate cAMP production even after receptor internalization, as β-arrestins are known to rapidly bind and internalize activated PTHR. Here we show that binding to β-arrestin1 prolongs rather than terminates the generation of cAMP by PTHR, and that cAMP generation correlates with the persistence of arrestin-receptor complexes on endosomes. PTHR signaling is instead turned off by the retromer complex, which regulates the movement of internalized receptor from endosomes to the Golgi apparatus. Thus, binding by the retromer complex regulates the sustained generation of cAMP triggered by an internalized GPCR.


Conflict of interest statement

Competing interests statement

The authors have no competing financial interests to disclose.

Figures
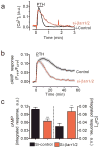
Figure 1
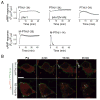
Figure 1. Time courses of cAMP and calcium responses to PTHR
a, HEK293 cells stably expressing PTHR were transfected with either si-RNA targeting both human β-arrestin1 and 2 (si-βArr1/2) or scrambled siRNA. Changes in the intracellular levels of Ca2+ in response to 100 nM PTH(1–34) were measured by epifluorescence imaging at 488 nm excitation. Traces are representatives N = 4 independent experiments and n = 28 (control), and n = 45 (si-βarr1/2) cells. b, Averaged cAMP response over a 50-min time course measured by FRET changes from HEK293 cells stably expressing PTHR and transiently expressing the cytoplasmic cAMP FRET sensor epacCFP/YFP. Cells were continuously perfused with control buffer or 100 nM PTH1–34 (horizontal bar). Data represents the mean ± s.e.m. of N = 4 independent experiments and n = 25 (control), and n = 20 (si-βarr1/2) cells. c, Bars represent the average calcium and cAMP responses for experiments represented in (a) and (b), respectively, determined by measuring the area under the curve from 0–3 min for calcium response, and 0–30 min for cAMP. Statistical analysis was performed by a t-Test (***, P < 0.001; **, P < 0.05).
Figure 2
Figure 2. Signaling and arrestin mobilization by PTH analogs
a–b, Averaged cAMP response over a 45-min time course measured by FRET change from HEK293 cells stably expressing PTHR and transiently expressing Epac-CFP/YFP. Cells were continuously perfused with control buffer or 100 nM of ligand (horizontal bars) Data represents the mean ± s.e.m. of N = 5 independent experiments and cell number n = 25 for PTH(1–34), n = 10 for M-PTH(1–14), n = 44 for M-PTH(1–28), n = 18 for βarr1, and n = 13 for βarr1[IV-AA]. c, PTHR-arrestin dynamics induced by PTH analogs. HEK293 cells were co-transfected with GFPN-PTHR and wild-type β-arr1tom or β-arrestin 1[IV-AA]tom and imaged at 1 min intervals for 1 h after a brief challenge with 100 nM PTH(1–34). The horizontal white bar represent 10 μM.
Figure 3
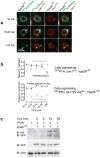
Figure 3. Retromer terminates the PTH-mediated cAMP response
a, Time-course of endosomal co-localization between PTHR, arrestin and retromer. HEK293 cells cotransfected to express GFPPTHR, Vps29YFP and β-arr1tom were challenged with a brief pulse of PTH(1–34) (100 nM), and endosomes were visualized on a confocal microscope using spectral and spatial deconvolution. Representative endosomes showed characteristic colocalization patterns of GFPPTHR, Vps29YFP and β-arr1tom at early (<15 min), medium (15–20 min) and late (>25 min) time points after ligand challenge. The horizontal white bar represent 1 μM. b, Quantitative analysis of experiments in a. Individual endosomes were classified according to time after ligand challenge and colocalization (Pearson’s, JACoP plugin, ImageJ) was measured for each endosome. Data represent the mean ± s.e.m of N = 4 independent experiments and n = 19 cells. We used a Pearson’s analysis to quantify the change of PTHR localization from arrestin- to retromer-labeled endosomal domains. For each individual endosome, simultaneously labeled with GFPPTHR/Vps29YFP/β-arr1tom or with GFPPTHR/Vps29YFP/β-arr1[IV-AA]tom, we measured the Pearson’s correlation coefficients for the colocalization between PTHR and arrestin, and between PTHR and retromer. c, PTHR-retromer interaction detected using co-immunoprecipitation. HEK293 cells co-transfected with HA-PTHR and either empty vector or Myc-Vps26 and Vps29YFP were challenged with carrier or with 100 nM PTH(1–34) for the designated time period at room temperature before lysis in ice-cold immunoprecipitation buffer. PTHR was immunoprecipitated with sepharose beads conjugated to anti-HA monoclonal antibody, and Vps29YFP was detected with a polyclonal antibody against GFP (n = 4).
Figure 4
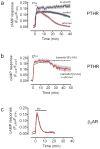
Figure 4. Modulation of PTHR signaling by retromer
a–b, Averaged cAMP response time-course measured by FRET changes from HEK-293 cells stably expressing PTHR (control, black), and transiently transfected to express (a) Vps26 and Vps29 (retromer, red), or siRNA of Vps35, and (b) βarr1[IV-AA]. Data represent the mean ± s.e.m of N = 4 independent experiments and cell number n = 10 (control), n = 15 (retromer), n = 15 (si-Vps35), and n = 9 (retromer + βarr1[IV-AA]). c, Averaged cAMP response time-course measured by FRET changes from HEK-293 cells expressing β2-AR alone (control, black), or in combination with Vps26 and Vps29 (retromer, red). Data represent the mean ± s.e.m of N = 4 independent experiments and cell number n = 20 (control), and n = 20 (retromer). Cells were continuously perfused with control buffer or 100 nM PTH(1–34) (a,b), or 10 mM isoproterenol (c) (horizontal bar).
Figure 5
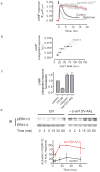
Figure 5. Retromer and arrestin regulate PTH-mediated cAMP production in bone cells
a, Averaged cAMP response measured by FRET changes in ROS17/2.8 cells expressing either epacCFP/YFP alone or co-expressing epacCFP/YFP with either β-arrestin1[IV-AA]tom or Vps26 and Vps29. Cells were treated with control buffer or a brief challenge of 100 nM PTH(1–34) (arrow). Data represent the mean ± s.e.m. of N = 4 independent experiments and n = 20 cells. b, Expression level of wild-type β-arrestin1 influences cAMP signaling. ROS cells co-transfected with epacCFP/YFP and β-arrestin1tom were challenged with PTH (100 nM) as in (a) and time-courses of cAMP response were measured as described in Figure 1. Integrated signaling was estimated by summing the area under the curve from 0–15 min after ligand challenge. Arrestin expression levels were estimated by epifluorescence imaging of tdTomato fluorescence. Integrated cAMP values were then binned according to arrestin expression level and plotted as averages (mean ± s.e.m. N = 4 independent experiments). The dotted line represents the 95% confidence interval. c, The total PTH-induced cAMP responses for experiments represented in the Supplementary Figure 6 were determined by measuring the area under the curve from 0–10 min. Bars represent the mean ± s.e.m. of N = 4 independent experiments and n = 12 (control), n = 14 (U0126), n = 15 (rolipram), and n = 20 (βarr1[IV-AA]) cells. d, Representative Western blots of time courses of ERK1/2 activation in ROS 17/2.8 cells control (Ctrl) or transiently transfected to express βarr1[IV-AA] in response to 100 nM PTH(1–34). The data are the mean ± s.e.m. of N = 3 separate experiments; Statistical comparison of the curves was performed by a two-way ANOVA (***, P < 0.001).
Figure 6
Figure 6
Mode of regulation of PTHR signaling by retromer and arrestin. PTH-activated PTHR (green) generating cAMP (grey) by activation of adenyly cyclases internalizes to endosomes in a process that involves binding of β-arrestin (red). Activated PTHR is then maintained in the early endosome bulk compartment by arrestin binding, where arrestin-mediated activation of ERK1/2 signaling causes inhibition of phosphodiesterases and permits sustained cAMP signaling. Binding of PTHR and retromer (blue) causes sorting of the receptor to retrograde trafficking domains. Generation of cAMP is stopped after either retromer binding in the retrograde domain or after retromer-mediated traffic to the Golgi.

Comment in

Similar articles

Cited by

References

    1. Perry SJ, et al. Targeting of cyclic AMP degradation to beta 2-adrenergic receptors by beta-arrestins. Science. 2002;298:834–6. - PubMed
    1. Premont RT, Gainetdinov RR. Physiological roles of G protein-coupled receptor kinases and arrestins. Annu Rev Physiol. 2007;69:511–34. - PubMed
    1. Hanyaloglu AC, von Zastrow M. Regulation of GPCRs by endocytic membrane trafficking and its potential implications. Annu Rev Pharmacol Toxicol. 2008;48:537–68. - PubMed
    1. Ferrandon S, et al. Sustained cyclic AMP production by parathyroid hormone receptor endocytosis. Nat Chem Biol. 2009;5:734–42. - PMC - PubMed
    1. Okazaki M, et al. Prolonged signaling at the parathyroid hormone receptor by peptide ligands targeted to a specific receptor conformation. Proc Natl Acad Sci U S A. 2008;105:16525–30. - PMC - PubMed

Publication types