. 2011 Jun;31(11):2241-52.
doi: 10.1128/MCB.01431-10. Epub 2011 Mar 28.

Human epidermal growth factor receptor (EGFR) aligned on the plasma membrane adopts key features of Drosophila EGFR asymmetry

Affiliations

Human epidermal growth factor receptor (EGFR) aligned on the plasma membrane adopts key features of Drosophila EGFR asymmetry

Christopher J Tynan et al. Mol Cell Biol. 2011 Jun.

Abstract

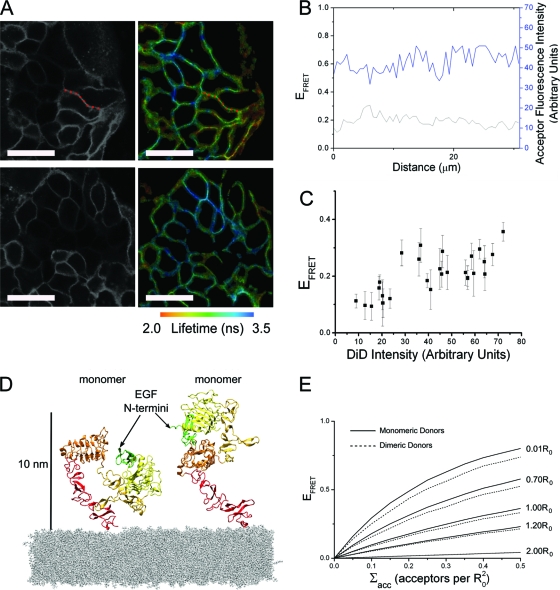
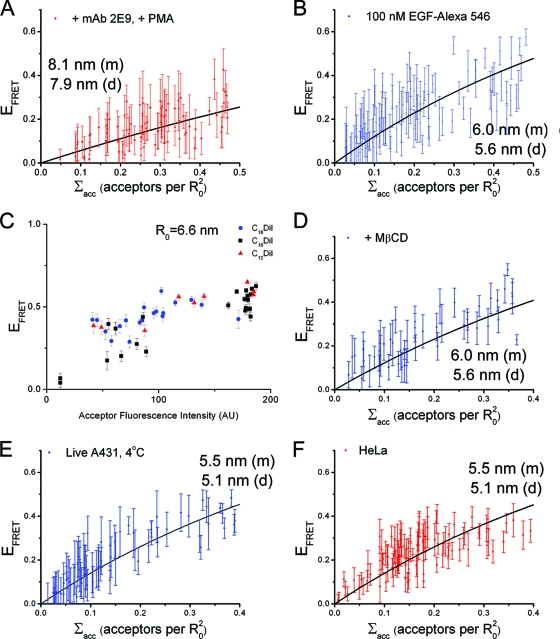
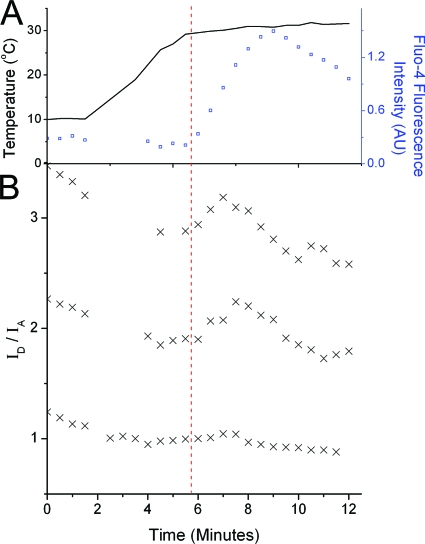
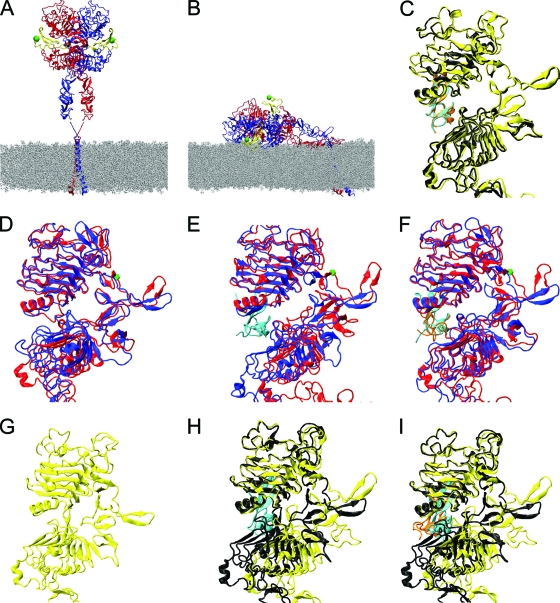
The ability of epidermal growth factor receptor (EGFR) to control cell fate is defined by its affinity for ligand. Current models suggest that ligand-binding heterogeneity arises from negative cooperativity in signaling receptor dimers, for which the asymmetry of the extracellular region of the Drosophila EGFR has recently provided a structural basis. However, no asymmetry is apparent in the isolated extracellular region of the human EGFR. Human EGFR also differs from the Drosophila EGFR in that negative cooperativity is found only in full-length receptors in cells. To gain structural insights into the human EGFR in situ, we developed an approach based on quantitative Förster resonance energy transfer (FRET) imaging, combined with Monte Carlo and molecular dynamics simulations, to probe receptor conformation in epithelial cells. We experimentally demonstrate a high-affinity ligand-binding human EGFR conformation consistent with the extracellular region aligned flat on the plasma membrane. We explored the relevance of this conformation to ligand-binding heterogeneity and found that the asymmetry of this structure shares key features with that of the Drosophila EGFR, suggesting that the structural basis for negative cooperativity is conserved from invertebrates to humans but that in human EGFR the extracellular region asymmetry requires interactions with the plasma membrane.


Figures

Fig. 1.
Fig. 1.
(A) Example FLIM maps and corresponding acceptor intensity images of A431 cells labeled with DiD and 1 nM EGF-Atto 488 (scale bar, 50 μm). (B) Plotting the calculated FRET efficiency and corresponding acceptor fluorescence intensity along a section of membrane indicated by the red dotted line in panel A shows small fluctuations with little cross-correlation. (C) The mean FRET efficiency from each area of homogenous DiD labeling in both example areas plotted as a function of mean DiD intensity. Error bars represent the standard deviation of the mean FRET efficiency. (D) The tethered and extended hEGFR structures place the N terminus of receptor-bound EGF at similar distances from the membrane. The figure is based on crystal structures 1NQL and 1IVO. At physiological pH, EGF is likely to bind to domain III of the tethered receptor rather than domain I as shown, in which case the distance to the membrane will be even closer to that of the extended receptor. (E) FRET efficiency as a function of acceptor density is shown for several donor-acceptor plane separations (normalized to the Förster radius, R0), produced by Monte Carlo simulations of monomeric or dimeric donors above a plane of randomly distributed acceptors.
Fig. 2.
Fig. 2.
(A) Comparison of the mean fluorescence intensity of EGF-Atto 647N measured in A431 cells after binding to saturating (100 nM) or subsaturating (1 nM) concentrations of EGF-Atto 647N, with or without prebinding of MAb 2E9. Also shown are the results of binding a saturating concentration of EGF after exposure to PMA. Each result was obtained from measurement of >500 cells. Error bars represent the standard errors of the means. (B) Mean fluorescence lifetime of EGF-Atto 488 bound to EGFR in A431 cell membranes after exposure to 0.5 nM, 1 nM, and 100 nM concentrations of EGF-Atto 488 obtained from 20, 27, and 54 cells, respectively. Error bars represent the standard deviations of the mean lifetimes.
Fig. 3.
Fig. 3.
Determination of the distance of closest approach of EGF binding sites to the cell surface. (A) Plots of FRET efficiency as a function of acceptor density measured in DiD-loaded A431 cells blocked with 200 nM MAb 2E9 before labeling hEGFRs with 100 nM EGF-Atto 488 (red) and without MAb 2E9 blocking (blue). (B) Results after labeling with 1 nM EGF-Atto 488. (C and D) Comparison of FRET data obtained from DiD-loaded A431 cells lightly fixed before or after labeling with 100 nM (C) and 1 nM (D) EGF-Atto 488. Each data point represents a stretch of cell membrane with homogeneous acceptor labeling, and error bars represent the standard deviations of the mean FRET efficiencies. The best fit of Monte Carlo simulation results to the data are shown and labeled with the corresponding distance of closest approach for monomeric (m) and dimeric (d) donors. The errors from uncertainty in the Monte Carlo model fitting were typically 1 to 1.5% of the calculated distance values.
Fig. 4.
Fig. 4.
Shown are plots of FRET efficiency as a function of acceptor density measured in DiD-loaded A431 cells labeled with 100 nM EGF-Alexa Fluor 546 after pretreatment with 200 nM MAb 2E9 and PMA (A) or from untreated cells (B). (C) FRET efficiency plotted as a function of acceptor fluorescence intensity for A431 cells labeled with 100 nM EGF-Atto 488 after loading with C18, C16, and C12 DiI. FRET efficiency is shown as a function of acceptor density measured in DiD-loaded A431 cells labeled with 100 nM EGF-Alexa Fluor 546 after depletion of membrane cholesterol by MβCD (D), in live cells at 4°C (E), and in HeLa cells (F). Where appropriate the best fit of Monte Carlo simulation results to the data are shown and labeled with the corresponding distance of closest approach for monomeric (m) and dimeric (d) donors.
Fig. 5.
Fig. 5.
EGFR ectodomain conformational changes that accompany signal transduction. (A) Raising the temperature of A431 cells labeled with 1 nM EGF-Atto 488 at 4°C results in an increase in free intracellular Ca2+ concentration (reported by an increase in Fluo-4 fluorescence intensity). (B) Example time courses of the FRET ratio ID/IA measured under the same experimental conditions. The upper two traces are taken from cells with high acceptor loading, and the bottom trace is from a cell displaying low acceptor loading. A transient increase in the FRET ratio (corresponding to a transient decrease in FRET efficiency) can be clearly seen above the slow decay in the FRET ratio caused by donor photobleaching. The red dashed line crossing both panels marks the onset of intracellular calcium release. AU, arbitrary units.
Fig. 6.
Fig. 6.
(A) The extended hEGFR ectodomain dimer with two bound ligands, modeled on crystallographic structures 1IVO and 1NQL and placed above modeled transmembrane helices in a POPC membrane. Receptor monomers are shown in red and blue ribbon representation, and both ligands are in yellow. Green spheres indicate the N termini of the ligands to which donor dyes are attached. (B) Endpoint of a molecular dynamics simulation of a doubly liganded, tilted ectodomain hEGFR dimer, relaxed on the membrane (23). Also shown are overlays of the left and right subunits of receptor dimers using domain I as a reference for doubly liganded soluble hEGFR (1IVO) (C), simulation of unliganded hEGFR relaxed on the membrane (D), simulation of singly liganded hEGFR relaxed on the membrane (E), simulation of doubly liganded hEGFR relaxed on the membrane (F), unliganded soluble dEGFR (3I2T) (G), singly liganded soluble dEGFR (3LTG) (H), and doubly liganded soluble dEGFR (3LTF) (I). The hEGFR residue Asp238 is highlighted by a green mark in panels D to F.

Similar articles

Cited by

References

    1. Adak S., Deandrade D., Pike L. J. 2011. The tethering arm of the EGF receptor is required for negative cooperativity and signal transduction. J. Biol. Chem. 286:1545–1555 - PMC - PubMed
    1. Alvarado D., Klein D. E., Lemmon M. A. 2010. Structural basis for negative cooperativity in growth factor binding to an EGF receptor. Cell 142:568–579 - PMC - PubMed
    1. Askari J. A., et al. 2010. Focal adhesions are sites of integrin extension. J. Cell Biol. 188:891–903 - PMC - PubMed
    1. Axelrod D. 1979. Carbocyanine dye orientation in red cell membrane studied by microscopic fluorescence polarization. Biophys. J. 26:557–573 - PMC - PubMed
    1. Bagossi P., Horváth G., Vereb G., Szöllösi J., Tözsér J. 2005. Molecular modeling of nearly full-length ErbB2 receptor. Biophys. J. 88:1354–1363 - PMC - PubMed

Publication types

MeSH terms