. 2011 Dec;50(12):972-80.
doi: 10.1002/mc.20767. Epub 2011 Mar 22.

Interaction of mutant hepatitis B X protein with p53 tumor suppressor protein affects both transcription and cell survival

Affiliations

Interaction of mutant hepatitis B X protein with p53 tumor suppressor protein affects both transcription and cell survival

Shoba Iyer et al. Mol Carcinog. 2011 Dec.

Abstract

This study examines the differential activities between wild-type Hepatitis B virus X protein (WtHBx) and a mutant HBx (MutHBx), which bears a hotspot mutation at nucleotides 1,762 and 1,764, resulting in a lysine to methionine change at codon 130 and a valine to isoleucine change at codon 131. This mutation leads to hepatocellular carcinoma, and we evaluated how WtHBx and MutHBx proteins differ in their interactions with the p53 tumor suppressor protein. This was experimentally addressed through co-immunoprecipitation assays examining the interaction between WtHBx and MutHBx proteins with p53, reporter assays determining the impact of the HBx proteins on p53-mediated gene transcription, and clonogenic survival assays evaluating the effect of HBx on cell growth in lines of varying p53-expression status. Both WtHBx and MutHBx proteins physically interact with p53 protein, but have different impacts on p53-mediated gene transcription. WtHBx did not effect p53-mediated gene transcription, whereas MutHBx inhibited it (P < 0.01). MutHBx inhibited colony formation in p53-proficient cells (P < 0.01), but not p53-deficient lines. Although both HBx proteins interact with p53, they affect p53-mediated gene transcription differently. WtHBx has no effect, whereas MutHBx inhibits it. In clonogenic survival assays, MutHBx inhibited cell growth in p53-proficient cells rather than enhanced it. This suggests that for MutHBx to behave oncogenically, the p53 pathway must be crippled or absent. This study has identified some important novel ways in which WtHBx and MutHBx differentially interact with p53 and this could begin to form the cellular explanation for the association between this particular mutant and liver cancer.


Figures

Figure 1
Figure 1
Amino acid alignment of HBx protein based on nucleotide sequence analysis of WtHBx and MutHBx. Only the two amino acid differences resulting from the A1762T/G1764A base mutations which distinguish MutHBx from WtHBx are indicated.
Figure 2
Figure 2
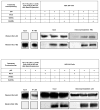
Figure 2A. Both WtHBx and MutHBx proteins bind to p53 protein. HEK 293 cells were transiently co-transfected with 5 μg p53 expression plasmid and 5 μg either mock (empty pTracer plasmid), WtHBx or MutHBx plasmid. Cells were lysed 48 hours post-transfection. HCT 116, p53 (−/−) cell lysates were used as negative controls due to their lack of both basal p53 and HBx expression. Lysates were immunoprecipitated with anti-HBx antibody and then subjected to SDS-PAGE and Western blot with anti-p53 antibody. Protein inputs to immunoprecipitation as well as immunoprecipitates are shown. Figure 2B. Reverse co-immunoprecipitation confirms that both WtHBx and MutHBx proteins bind to p53 protein. HEK 293 cell lysates were immunoprecipitated with anti-p53 antibody and then subjected to SDS-PAGE and Western blot with anti-HBx antibody.
Figure 3
Figure 3
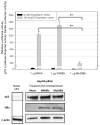
Figure 3A. Inhibition of p53-mediated transcriptional activity by MutHBx but not WtHBx. Luciferase reporter activity assays were conducted in HepG2-p53si cells. 100ng p53 expression plasmid/mL and 1 μg either mock, WtHBx or MutHBx/mL were transiently co-expressed in the cells 48 hours prior to lysate collection and assaying. Results shown represent mean values from three independent experiments and bars indicate standard error of the mean. **p < 0.01. Figure 3B. siRNA construct produced in HepG2-p53si cells does not abolish expression of p53 delivered to the cells, nor does HBx expression impact p53 expression. Protein expression of p53 and HBx is displayed at 48 hours post-transfection, which is the time course for the luciferase reporter assays conducted. β-actin expression was monitored as a loading control.
Figure 4
Figure 4
Figure 4A. Both WtHBx and MutHBx expression result in increased serine 15 phosphorylation of p53 (phospho-Ser15). 1.67 μg p53/mL and 1.67 μg either mock, WtHBx or MutHBx/mL were transiently co-expressed in HepG2-p53si cells 48 hours prior to total cell lysate collection, SDS-PAGE and Western blot analysis. Representative results from three independent transfection experiments are shown. Figure 4B. MutHBx expression is associated with an increase in phospho-Ser15 compared to WtHBx expression. Densitometry was performed on phospho-Ser15 from Western blots in each of three independent transfection experiments. Values shown here are normalized to HBx/β-actin densitometry ratios (HBx densitometry value normalized to that β-actin loading control) as loading, transfection and protein expression controls. Bars indicate standard error of the mean. *p < 0.05.
Figure 4
Figure 4
Figure 4A. Both WtHBx and MutHBx expression result in increased serine 15 phosphorylation of p53 (phospho-Ser15). 1.67 μg p53/mL and 1.67 μg either mock, WtHBx or MutHBx/mL were transiently co-expressed in HepG2-p53si cells 48 hours prior to total cell lysate collection, SDS-PAGE and Western blot analysis. Representative results from three independent transfection experiments are shown. Figure 4B. MutHBx expression is associated with an increase in phospho-Ser15 compared to WtHBx expression. Densitometry was performed on phospho-Ser15 from Western blots in each of three independent transfection experiments. Values shown here are normalized to HBx/β-actin densitometry ratios (HBx densitometry value normalized to that β-actin loading control) as loading, transfection and protein expression controls. Bars indicate standard error of the mean. *p < 0.05.
Figure 5
Figure 5
Figure 5A. Basal p53 expression status of each cell line used in clonogenicity assays. HepG2 cells are p53-proficient, while HepG2-p53si and Hep3B cells are p53-deficient. Lysates from each cell type were collected and analyzed by SDS-PAGE and Western blot using anti-p53 antibody and anti-β-actin as a loading control. Figure 5B. Representative examples of colony formation across various cell lines for each plasmid construct utilized- mock, WtHBx and MutHBx, respectively. HepG2 cells are p53-proficient and HepG2-p53si and Hep3B cell lines are p53-deficient. Cells were transfected with 1.25 μg either mock, WtHBx or MutHBx/mL. Figure 5C. Enhanced growth suppressive effect of MutHBx colonies compared to WtHBx colonies in p53-proficient hepatocellular carcinoma cells (HepG2) only. Results shown represent mean values from three independent experiments and bars indicate standard error of the mean. *p < 0.05; **p < 0.01. Figure 5D. Unique splayed morphology of apparently dormant HepG2 cells expressing MutHBx. Cell morphology images of liver cell colonies taken 2 weeks into clonogenicity assay when colony formation in mock and WtHBx-transfected cells was well underway.
Figure 5
Figure 5
Figure 5A. Basal p53 expression status of each cell line used in clonogenicity assays. HepG2 cells are p53-proficient, while HepG2-p53si and Hep3B cells are p53-deficient. Lysates from each cell type were collected and analyzed by SDS-PAGE and Western blot using anti-p53 antibody and anti-β-actin as a loading control. Figure 5B. Representative examples of colony formation across various cell lines for each plasmid construct utilized- mock, WtHBx and MutHBx, respectively. HepG2 cells are p53-proficient and HepG2-p53si and Hep3B cell lines are p53-deficient. Cells were transfected with 1.25 μg either mock, WtHBx or MutHBx/mL. Figure 5C. Enhanced growth suppressive effect of MutHBx colonies compared to WtHBx colonies in p53-proficient hepatocellular carcinoma cells (HepG2) only. Results shown represent mean values from three independent experiments and bars indicate standard error of the mean. *p < 0.05; **p < 0.01. Figure 5D. Unique splayed morphology of apparently dormant HepG2 cells expressing MutHBx. Cell morphology images of liver cell colonies taken 2 weeks into clonogenicity assay when colony formation in mock and WtHBx-transfected cells was well underway.

Similar articles

Cited by

References

    1. Garcia M, Jemal A, Ward E, Center M, Hao Y, Siegel R, Thun M. Global Cancer Facts & Figures 2007. American Cancer Society; 2007.
    1. Thomas M, Zhu A. Hepatocellular carcinoma: The need for progress. Journal of Clinical Oncology. 2005;23(13):2892–2899. - PubMed
    1. Wang X, Forrester K, Yeh H, Feitelson M, Gu J-R, Harris C. Hepatitis B virus X protein inhibits p53 sequence-specific DNA binding, transcriptional activity, and association with transcription factor ERCC3. Proceedings of the National Academy of Sciences. 1994;91(6):2230–2234. - PMC - PubMed
    1. Elmore L, Hancock A, Chang S-F, Wang X, Chang S, Callahan C, Geller D, Will H, Harris C. Hepatitis B virus X protein and p53 tumor suppressor interactions in the modulation of apoptosis. Proceedings of the National Academy of Sciences. 1997;94(26):14707–14712. - PMC - PubMed
    1. Feitelson M, Ranganathan P, Clayton M, Zhang S. Partial characterization of the woodchuck tumor suppressor, p53, and its interaction with woodchuck hepatitis virus X antigen. Oncogene. 1997;1997(15):3. - PubMed

Publication types

MeSH terms