. 2011 Mar 23;31(12):4720-30.
doi: 10.1523/JNEUROSCI.3076-10.2011.

In vivo positron emission tomographic imaging of glial responses to amyloid-beta and tau pathologies in mouse models of Alzheimer's disease and related disorders

Affiliations

In vivo positron emission tomographic imaging of glial responses to amyloid-beta and tau pathologies in mouse models of Alzheimer's disease and related disorders

Jun Maeda et al. J Neurosci. .

Abstract

Core pathologies of Alzheimer's disease (AD) are aggregated amyloid-β peptides (Aβ) and tau, and the latter is also characteristic of diverse neurodegenerative tauopathies. These amyloid lesions provoke microglial activation, and recent neuroimaging technologies have enabled visualization of this response in living brains using radioligands for the peripheral benzodiazepine receptor also known as the 18 kDa translocator protein (TSPO). Here, we elucidated contributions of Aβ and tau deposits to in vivo TSPO signals in pursuit of mechanistic and diagnostic significance of TSPO imaging in AD and other tauopathies. A new antibody to human TSPO revealed induction of TSPO-positive microgliosis by tau fibrils in tauopathy brains. Emergence of TSPO signals before occurrence of brain atrophy and thioflavin-S-positive tau amyloidosis was also demonstrated in living mice transgenic for mutant tau by positron emission tomography (PET) with two classes of TSPO radioligands, [(11)C]AC-5216 and [(18)F]fluoroethoxy-DAA1106. Meanwhile, only modest TSPO elevation was observed in aged mice modeling Aβ plaque deposition, despite the notably enhanced in vivo binding of amyloid radiotracer, [(11)C]Pittsburgh Compound-B, to plaques. In these animals, [(11)C]AC-5216 yielded better TSPO contrasts than [(18)F]fluoroethoxy-DAA1106, supporting the possibility of capturing early neurotoxicity with high-performance TSPO probes. Furthermore, an additional line of mice modeling intraneuronal Aβ accumulation displayed elevated TSPO signals following noticeable neuronal loss, unlike TSPO upregulation heralding massive neuronal death in tauopathy model mice. Our data corroborate the utility of TSPO-PET imaging as a biomarker for tau-triggered toxicity, and as a complement to amyloid scans for diagnostic assessment of tauopathies with and without Aβ pathologies.


Figures
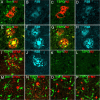
Figure 1.
Figure 1.
Emergence of TSPO-expressing microglia in AD and non-AD tauopathy brains as assessed by fluorescence microscopy. A–D, Triple labeling of a diffuse plaque in a frontal cortex section of AD brain (A, B) and its adjacent slice (C, D). The plaque deposition enriched with AβN3pE (red in A, C) was weakly stained with FSB (B, D), and induced recruitment of a few Iba-1-immunoreactive microglia (green in A), which were negative for TSPO (green in C). E–H, Double labeling of neuritic plaques in a hippocampal section of AD brain (E, F) and its adjacent slice (G, H). The AβN3pE-rich plaques (red in E, G) contained dense amyloid cores and dystrophic neurites strongly stained with FSB (F, H), and were surrounded by Iba-1 (green in E) and TSPO (green in G) immunoreactivities. I, J, Triple staining of a neuritic plaque in AD hippocampus, showing intense FSB labeling (J) and no overlaps between TSPO (green in I) and GFAP (red in I) immunoreactivities. K, L, Double immunostaining of frontal cortex sections generated from a nondemented control brain sample. Resident microglia displayed faint Iba-1 (green in K) but no TSPO (green in L) signals. AβN3pE-positive lesions were barely detectable (red in K, L). M–P, Two-channel fluorescence microscopic views of frontal cortex sections generated from PSP (M, N) and Pick's disease (O, P) brains. Anti-phospho-tau antibody, AT8, illuminated numerous neuropil threads, NFTs (red in M, N) and Pick's bodies (red in O, P). Iba-1 (green in M, O) and TSPO (green in N, P) immunoreactivities were present in cells with nearly the same morphology, which were characterized as putative microglia.
Figure 2.
Figure 2.
A–C, Induction of neuroinflammatory TSPO signals in PS19 mice detected by in vivo PET (A, B) and ex vivo autoradiographic (C) imaging with [11C]AC-5216. A, B, Orthogonal views of TSPO distributions in brains of 11-month-old nTg (A) and PS19 Tg (B) mice scanned by PET at 30–90 min after intravenous injection of [11C]AC-5216. Coronal images (top) were generated to include the striatum (left; bregma +0.5 mm) and dorsal (middle; bregma −2.2 mm) and ventral (right; bregma −3.6 mm) hippocampi, and sagittal (bottom left) and horizontal (bottom right) slices were constructed at 1.7 mm lateral to the midline and 3.0 mm ventral to the bregma, respectively. PET maps are superimposed on the MRI anatomical template. C, Ex vivo autoradiographic mapping of TSPO in brains of 13-month-old nTg mouse, 11-month-old PS19 mouse with marginal neurodegenerative changes, and 11- and 14-month-old PS19 mice with massive neuronal loss in the hippocampus and entorhinal cortex. Brain tissues were collected at 30 min after intravenous injection of [11C]AC-5216, and coronal sections were generated to contain the hippocampus (bregma −2.8 mm).
Figure 3.
Figure 3.
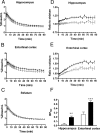
Kinetics of intravenously administered [11C]AC-5216 in brains of 11-month-old nTg (open symbols; n = 6) and PS19 Tg (closed symbols; n = 8) mice. A–C, Time-radioactivity curves in the hippocampus (A), entorhinal cortex (B), and striatum (C) obtained from dynamic PET scans. D, E, Target-to-cerebellum ratio of radioactivities in the hippocampus (D) and entorhinal cortex (E). F, BPND values for radioligand binding to TSPO in the hippocampus and entorhinal cortex calculated by simplified reference tissue model. **p < 0.01 and ***p < 0.001 by Bonferroni's multiple comparison after ANOVA. Error bars represent SE.
Figure 4.
Figure 4.
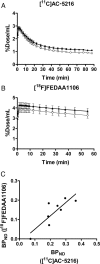
Comparison of brain kinetics and performance in detecting neuroinflammatory changes between two TSPO ligands, [11C]AC-5216 and [18F]FEDAA1106, in 11-month-old PS19 Tg mice (n = 8). A, B, Hippocampal (closed circles) and striatal (open circles) time-radioactivity curves in mice following intravenous injection of [11C]AC-5216 (A) and [18F]FEDAA1106 (B). Error bars represent SE. C, Scatterplot of hippocampal BPND for [18F]FEDAA1106 against that for [11C]AC-5216 in each individual. Significant correlation between these BPND estimates was observed (r2 = 0.71, p < 0.01 by F test), while [11C]AC-5216 yielded larger values and better detectability of subtle inflammations than did [18F]FEDAA1106. Solid line indicates the regression for all mice.
Figure 5.
Figure 5.
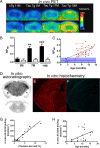
Progressive increase of PET and autoradiographic [11C]AC-5216 signals in the hippocampus of PS19 mice as a function of age and phosphorylated tau load. A, Coronal PET images containing the striatum (top) and hippocampus (bottom) in 11-month-old nTg and 7-, 11-, and 13-month-old PS19 Tg mice. Images were generated by averaging dynamic scan data at 30–90 min after radiotracer injection. B, BPND for [11C]AC-5216 in the hippocampus of nTg (open columns) and PS19 Tg (closed columns) mice at 3, 7, and 11 months of age. **p < 0.01 and ***p < 0.001 by Bonferroni's multiple comparison after ANOVA. Error bars represent SE. C, Scatterplot of hippocampal BPND for [11C]AC-5216 against age in PS19 Tg mice (n = 28; mean age ± SD = 8.9 ± 3.4 months; age range, 2.2–14.6 months). Red symbols represent data from a longitudinal analysis of the same individuals (n = 9), and the blue line and purple area indicate the mean ± SD of hippocampal BPND values in nTg mice (n = 17; mean age ± SD = 7.5 ± 3.6 months; age range, 2–12 months). The increase of BPND in PS19 Tg mice became noticeable at ∼6 months of age, and was thereafter augmented in a significant correlation with age (r2 = 0.40, p < 0.001 by Pearson's correlation coefficient). The broken line denotes the regression in PS19 Tg mice. D, Representative in vitro autoradiograms showing total (top section) and nonspecific (bottom section) binding of [11C]AC-5216 in coronal brain slices obtained from a 12-month-old PS19 Tg mouse. Marked signal intensification was observed in the hippocampus, which exhibited severe atrophy. E, F, Double fluorescence labeling of the section shown in D with anti-phospho-tau antibody, AT8 (E), and amyloid dye, thioflavin-S (F). Numerous AT8-positive lesions lacking thioflavin-S positivity were present, and were conceived to be relatively immature intraneuronal amyloid fibrils. G, H, Scatterplots of autoradiographic [11C]AC-5216 binding in the hippocampus of PS19 mice (n = 21) against AT8-positive phospho-tau load (G; expressed as percentage of total hippocampal area) and age (H). The solid lines represent regression.
Figure 6.
Figure 6.
PET and autoradiographic images of TSPO upregulation in old APP23 mice. A, Coronal PET images containing the striatum (top) and hippocampus (bottom) in 28-month-old nTg and 26-month-old APP23 Tg mice. Images were generated by averaging dynamic scan data at 30–60 min after [11C]AC-5216 injection. B, Ex vivo autoradiographic sections containing the hippocampus (at bregma −2.8 mm) in 27-month-old nTg and 30-month-old APP23 Tg mice. Brains were collected at 30 min after intravenous injection of [11C]AC-5216. C, Amyloidosis-associated in vitro autoradiographic [11C]AC-5216 signals in a 24-month-old APP23 Tg mouse brain section. The autoradiographic section (left) was subsequently stained with an amyloid dye, FSB (middle), and colocalization of radiotracer binding and plaque deposition was assessed in a merged image (right).
Figure 7.
Figure 7.
Kinetics of intravenously administered [11C]AC-5216 in brains of 24-month-old nTg (open symbols; n = 5) and APP23 Tg (closed symbols; n = 9) mice. A–C, Time-radioactivity curves in the hippocampus (A), entorhinal cortex (B), and striatum (C) obtained from dynamic PET scans. D, E, Target-to-cerebellum ratio of radioactivities in the hippocampus (D) and entorhinal cortex (E). F, BPND values for radioligand binding to TSPO in the hippocampus and entorhinal cortex calculated by simplified reference tissue model. *p < 0.05 and **p < 0.01 by Bonferroni's multiple comparison after ANOVA. Error bars represent SE.
Figure 8.
Figure 8.
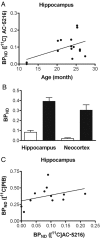
Association of TSPO signals with age-dependent deposition of Aβ amyloid in living brains of APP23 mice. A, Scatterplot of BPND for [11C]AC-5216 against age in the hippocampus of APP23 Tg mice (n = 15; mean age ± SD = 22.4 ± 4.9 months; age range, 12–28.4 months). The solid line represents regression. B, BPND of [11C]AC-5216 (open columns) and an amyloid radioligand, [11C]PIB (closed columns), in the hippocampus of APP23 Tg mice (n = 12; mean age ± SD = 22.6 ± 5.3 months; age range, 12–28.4 months). Error bars represent SE. C, Scatterplot of BPND for [11C]PIB against that for [11C]AC-5216 in the hippocampus of APP23 Tg mice (n = 12; mean age ± SD = 22.6 ± 5.3 months; age range, 12–28.4 months). The solid line represents regression.
Figure 9.
Figure 9.
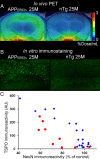
TSPO upregulation and neuronal loss in APPE693Δ and PS19 mice. A, Coronal PET images containing the hippocampus in 25.4-month-old APPE693Δ Tg (left) and 25-month-old nTg (right) mice. Images were generated by averaging dynamic scan data at 30–60 min after [11C]AC-5216 injection. B, Immunolabeling of TSPO with NP155 in the hippocampal CA1 region of 25.4-month-old APPE693Δ Tg (left; the same animal as shown in A) and 25-month-old nTg (right) mice. C, Intensity of TSPO immunolabeling (arbitrary values) plotted against NeuN immunoreactivity (percentage of area in controls matched by age with each individual) in APPE693Δ (red circles; n = 9; 22–33 months of age) and PS19 mice (blue rhombuses; n = 21; 3–17 months of age).

Similar articles

Cited by

References

    1. Asuni AA, Boutajangout A, Quartermain D, Sigurdsson EM. Immunotherapy targeting pathological tau conformers in a tangle mouse model reduces brain pathology with associated functional improvements. J Neurosci. 2007;27:9115–9129. - PMC - PubMed
    1. Bellucci A, Westwood AJ, Ingram E, Casamenti F, Goedert M, Spillantini MG. Induction of inflammatory mediators and microglial activation in mice transgenic for mutant human P301S tau protein. Am J Pathol. 2004;165:1643–1652. - PMC - PubMed
    1. Block ML, Zecca L, Hong JS. Microglia-mediated neurotoxicity: uncovering the molecular mechanisms. Nat Rev Neurosci. 2007;8:57–69. - PubMed
    1. Cagnin A, Brooks DJ, Kennedy AM, Gunn RN, Myers R, Turkheimer FE, Jones T, Banati RB. In-vivo measurement of activated microglia in dementia. Lancet. 2001;358:461–467. - PubMed
    1. Diorio D, Welner SA, Butterworth RF, Meaney MJ, Suranyi-Cadotte BE. Peripheral benzodiazepine binding sites in Alzheimer's disease frontal and temporal cortex. Neurobiol Aging. 1991;12:255–258. - PubMed

Publication types

MeSH terms

Substances

LinkOut - more resources