Short telomeres compromise β-cell signaling and survival
- PMID: 21423765
- PMCID: PMC3053388
- DOI: 10.1371/journal.pone.0017858
Short telomeres compromise β-cell signaling and survival
Abstract
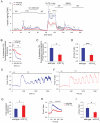
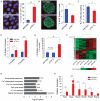
The genetic factors that underlie the increasing incidence of diabetes with age are poorly understood. We examined whether telomere length, which is inherited and known to shorten with age, plays a role in the age-dependent increased incidence of diabetes. We show that in mice with short telomeres, insulin secretion is impaired and leads to glucose intolerance despite the presence of an intact β-cell mass. In ex vivo studies, short telomeres induced cell-autonomous defects in β-cells including reduced mitochondrial membrane hyperpolarization and Ca(2+) influx which limited insulin release. To examine the mechanism, we looked for evidence of apoptosis but found no baseline increase in β-cells with short telomeres. However, there was evidence of all the hallmarks of senescence including slower proliferation of β-cells and accumulation of p16(INK4a). Specifically, we identified gene expression changes in pathways which are essential for Ca(2+)-mediated exocytosis. We also show that telomere length is additive to the damaging effect of endoplasmic reticulum stress which occurs in the late stages of type 2 diabetes. This additive effect manifests as more severe hyperglycemia in Akita mice with short telomeres which had a profound loss of β-cell mass and increased β-cell apoptosis. Our data indicate that short telomeres can affect β-cell metabolism even in the presence of intact β-cell number, thus identifying a novel mechanism of telomere-mediated disease. They implicate telomere length as a determinant of β-cell function and diabetes pathogenesis.
Conflict of interest statement
Figures


Similar articles
-
p16(Ink4a)-induced senescence of pancreatic beta cells enhances insulin secretion.Nat Med. 2016 Apr;22(4):412-20. doi: 10.1038/nm.4054. Epub 2016 Mar 7. Nat Med. 2016. PMID: 26950362 Free PMC article.
-
Proinsulin atypical maturation and disposal induces extensive defects in mouse Ins2+/Akita β-cells.PLoS One. 2012;7(4):e35098. doi: 10.1371/journal.pone.0035098. Epub 2012 Apr 3. PLoS One. 2012. PMID: 22509386 Free PMC article.
-
Haploid insufficiency of suppressor enhancer Lin12 1-like (SEL1L) protein predisposes mice to high fat diet-induced hyperglycemia.J Biol Chem. 2011 Jun 24;286(25):22275-82. doi: 10.1074/jbc.M111.239418. Epub 2011 May 2. J Biol Chem. 2011. PMID: 21536682 Free PMC article.
-
Guards and culprits in the endoplasmic reticulum: glucolipotoxicity and β-cell failure in type II diabetes.Exp Diabetes Res. 2012;2012:639762. doi: 10.1155/2012/639762. Epub 2011 Oct 1. Exp Diabetes Res. 2012. PMID: 21977023 Free PMC article. Review.
-
Effects of ageing and senescence on pancreatic β-cell function.Diabetes Obes Metab. 2016 Sep;18 Suppl 1:58-62. doi: 10.1111/dom.12719. Diabetes Obes Metab. 2016. PMID: 27615132 Review.
Cited by
-
Changes in stress, eating, and metabolic factors are related to changes in telomerase activity in a randomized mindfulness intervention pilot study.Psychoneuroendocrinology. 2012 Jul;37(7):917-28. doi: 10.1016/j.psyneuen.2011.10.008. Epub 2011 Dec 14. Psychoneuroendocrinology. 2012. PMID: 22169588 Free PMC article. Clinical Trial.
-
Genomic Instability and Epigenetic Changes during Aging.Int J Mol Sci. 2023 Sep 19;24(18):14279. doi: 10.3390/ijms241814279. Int J Mol Sci. 2023. PMID: 37762580 Free PMC article. Review.
-
The interaction between the yeast telomerase RNA and the Est1 protein requires three structural elements.RNA. 2012 Sep;18(9):1597-604. doi: 10.1261/rna.034447.112. Epub 2012 Jul 30. RNA. 2012. PMID: 22847816 Free PMC article.
-
Genetic modifiers of cystic fibrosis-related diabetes.Diabetes. 2013 Oct;62(10):3627-35. doi: 10.2337/db13-0510. Epub 2013 May 13. Diabetes. 2013. PMID: 23670970 Free PMC article.
-
ΩqPCR measures telomere length from single-cells in base pair units.Nucleic Acids Res. 2021 Nov 18;49(20):e120. doi: 10.1093/nar/gkab753. Nucleic Acids Res. 2021. PMID: 34534325 Free PMC article.
References
-
- Prevention CfDCa. National diabetes fact sheet: general information and national estimates on diabetes in the United States, 2007. 2008. US Department of Health and Human Services, Centers for Disease Control and Prevention.
-
- Butler AE, Janson J, Bonner-Weir S, Ritzel R, Rizza RA, et al. Beta-cell deficit and increased beta-cell apoptosis in humans with type 2 diabetes. Diabetes. 2003;52:102–110. - PubMed
-
- Yoon KH, Ko SH, Cho JH, Lee JM, Ahn YB, et al. Selective beta-cell loss and alpha-cell expansion in patients with type 2 diabetes mellitus in Korea. J Clin Endocrinol Metab. 2003;88:2300–2308. - PubMed
-
- Saxena R, Voight BF, Lyssenko V, Burtt NP, de Bakker PI, et al. Genome-wide association analysis identifies loci for type 2 diabetes and triglyceride levels. Science. 2007;316:1331–1336. - PubMed
Publication types
MeSH terms
Substances
Grants and funding
LinkOut - more resources
Full Text Sources
Other Literature Sources
Molecular Biology Databases
Miscellaneous

