. 2011;12(3):R22.
doi: 10.1186/gb-2011-12-3-r22. Epub 2011 Mar 16.

Improving RNA-Seq expression estimates by correcting for fragment bias

Affiliations

Improving RNA-Seq expression estimates by correcting for fragment bias

Adam Roberts et al. Genome Biol. 2011.

Abstract

The biochemistry of RNA-Seq library preparation results in cDNA fragments that are not uniformly distributed within the transcripts they represent. This non-uniformity must be accounted for when estimating expression levels, and we show how to perform the needed corrections using a likelihood based approach. We find improvements in expression estimates as measured by correlation with independently performed qRT-PCR and show that correction of bias leads to improved replicability of results across libraries and sequencing technologies.


Figures
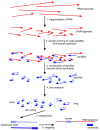
Figure 1
Figure 1
Overview of a typical RNA-Seq experiment. RNA is initially fragmented (1) followed by first-strand synthesis priming (2), which selects the 3' fragment end (in transcript orientation), to make single stranded cDNA. Double stranded cDNA created during second-strand synthesis (3), which selects the 5' fragment end, is then size selected (4) resulting in fragments suitable for sequencing (5). Sequenced reads are mapped to opposite strands of the genome (6), and in the case of known transcript or fragment strandedness, the read alignments reveal the 5' and 3' ends of the sequenced fragment (see Supplementary methods in Additional file 3). All arrows are directed 5' to 3' in transcript orientation.
Figure 2
Figure 2
Nucleotide distribution surrounding fragment ends and calculation of bias weights. (a) Sequence logos showing the distribution of nucleotides in a 23 bp window surrounding the ends of fragments from an experiment primed with 'not not so random' (NNSR) hexamers [11]. The 3' end sequences are complemented (but not reversed) to show the sequence of the primer during first-strand synthesis (see Figure 1). The offset is calculated so that zero is the 'first' base of the end sequence and only non-negative values are internal to the fragment. Counts were taken only from transcripts mapping to single-isoform genes. (b) Sequence logo showing normalized nucleotide frequencies after reweighting by initial (not bias corrected) FPKM in order to account for differences in abundance. (c) The background distribution for the yeast transcriptome, assuming uniform expression of all single-isoform genes. The difference in 5' and 3' distributions are due to the ends being primed from opposite strands. Comparing (c) to (a) and (b) shows that while the bias is confounded with expression in (a), the abundance normalization reveals the true bias to extend from 5 bp upstream to 5 bp downstream of the fragment end. Taking the ratio of the normalized nucleotide frequencies (b) to the background (c) for the NNSR dataset gives bias weights (d), which further reveal that the bias is partially due to selection for upstream sequences similar to the strand tags, namely TCCGATCTCT in first-strand synthesis (which selects the 5' end) and TCCGATCTGA in second-strand synthesis (which selects the 3' end). Although the weights here are based on independent frequencies, we found correlations among sites in the window and take these into account in our full model to produce more informative weights (see Supplementary methods in Additional file 3). A similar figure to this for the standard Illumina Random Hexamer protocol and plots similar to (d) for all datasets in the paper can be found in Figures S1 and S2 of Additional file 1 respectively.
Figure 3
Figure 3
Bias correction within transcripts. An example showing the effect of bias correction on the read counts for human transcript NM_004684. The top panel shows raw read counts (number of 3' ends of fragments at each location), and the bottom panel shows the product of the bias parameters (total bias weight defined in the Supplementary methods in Additional file 3) at the same locations. We correctly identify bias at different positions and can therefore correct for the non-uniformity. Note that the bias parameters were learned from the entire dataset excluding reads mapped to this transcript in order to cross-validate our results. The RNA-Seq for the experiment was performed with the NSR protocol [21], which is why 3' counts were used instead of 5'.
Figure 4
Figure 4
Correlation between RNA-Seq and qRT-PCR. (a) Expression estimates before bias correction (tail of arrows) and after correction (points of arrows) for the SRA012427 dataset compared to qRT-PCR values for the same transcripts. Red arrows show decrease in expression after correction and blue an increase. Note that we have zoomed in on lower-expression transcripts (the majority) for clarity. (b) Distribution of log-fold change in expression after bias correction.
Figure 5
Figure 5
Comparison with previous methods. A comparison of our method (Cufflinks) with Genominator[8] and mseq[10]. The y-axis shows the R2 value for the correlation between uncorrected (green) and bias corrected (orange) RNA-Seq expression estimates and qRT-PCR for the three methods. Correlation plots for these data can be found in Figure S3 of Additional file 1.
Figure 6
Figure 6
Variable technical replicates. Results of correlation tests showing improvement after bias correction for technical replicates. Fraction Explained Discrepancy was calculated by dividing the change in R2 after bias correction by the difference of the initial R2 from one (a perfect correlation). Note that when two RNA-Seq datasets are compared, the correction in the legend was applied to both. The pairwise correlations of the four SRA010153 replicates versus qRT-PCR and SRA008403, respectively, were averaged for the figure. Even though the same RH priming protocol was used in both labs, the bias differs slightly (see Figure S2 of Additional file 1) between the preps, which is why our correction method was able to improve the correlation.
Figure 7
Figure 7
Variable library preparations. Results of correlation tests showing improvement after bias correction of datasets generated using different library prep methods, all of which are strand-specific. The first four protocols are described in [11] and the final in [21]. All datasets were compared against a control that was generated using the standard Illumina RH protocol. The first four datasets used the control from [11] with the same yeast sample. The last dataset (NSR) was compared against the HBR dataset from SRA010153 since it is also consists of single-end reads.
Figure 8
Figure 8
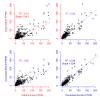
Bias in different sequence technologies. Results of correlation tests showing improvement after bias correction of datasets generated using different sequencing technologies. The Illumina dataset is SRA012427 (x-axes) and the SOLiD data is SOLiD4_ HBR_PE_50x25 (y-axes). Both used the same MAQC HBR sample. Red axes and lines denote uncorrected FPKM values and blue corrected, while purple regression lines denote a comparison between corrected and uncorrected values. Both datasets are being corrected for different biases, which causes their expression estimates to become more correlated. Note that the plot is zoomed in on the lower abundance transcripts for clarity but captures over 98% of those in the experiment.
Figure 9
Figure 9
Positional bias correction effect on expression. This figure shows the effective length fold change due to positional bias correction for the SRA012427 dataset. So that the parameters would be consistent for all transcripts, we have limited the analysis to transcripts with length greater than 2,433, which is the largest of the 5 length bins we use for measuring positional bias. As expected, all single isoform genes are adjusted in the same way, whereas isoform deconvolution is altered based on the difference in relative position within a transcript for a read that maps to multiple isoforms.
Figure 10
Figure 10
Correlation of GC content with measured bias. Panel a shows an example from human and panel b from yeast. Since the log fold change in effective length does not capture the full bias measurement for multiple isoform genes, the plots are limited to those with single isoforms. GC content appears to be correlated with our sequence bias measurements in some datasets, but not in others. GC content alone is not always a good proxy for fragment end bias.

Similar articles

Cited by

References

    1. Marguerat S, Bähler J. RNA-Seq: from technology to biology. Cellular and Molecular Life Sciences. 2010;67:569–579. doi: 10.1007/s00018-009-0180-6. - DOI - PMC - PubMed
    1. Jiang H, Wong W. Statistical inferences for isoform expression in RNA-Seq. Bioinformatics. 2009;25:1026–1032. doi: 10.1093/bioinformatics/btp113. - DOI - PMC - PubMed
    1. Li B, Ruotti V, Stewart R, Thomson J, Dewey C. RNA-Seq gene expression estimation with read mapping uncertainty. Bioinformatics. 2010;26:493–500. doi: 10.1093/bioinformatics/btp692. - DOI - PMC - PubMed
    1. Nicolae M, Mangul S, Măndoiu I, Zelikovsky A. Estimation of alternative splicing isoform frequencies from RNA-Seq data. Algorithms in Bioinformatics. 2010;6293:202–214. full_text. - PMC - PubMed
    1. Paşaniuc B, Zaitlen N, Halperin E. In: Research in Computational Molecular Biology. Berger B, editor. Berlin/Heidelberg: Springer; 2010. Accurate estimation of expression levels of homologous genes in RNA-seq experiments. pp. 397–409. [Lecture Notes in Computer Science, vol 6044.] - PubMed

Publication types