Glutamate transport decreases mitochondrial pH and modulates oxidative metabolism in astrocytes
- PMID: 21389211
- PMCID: PMC6622778
- DOI: 10.1523/JNEUROSCI.4378-10.2011
Glutamate transport decreases mitochondrial pH and modulates oxidative metabolism in astrocytes
Abstract
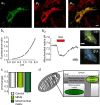
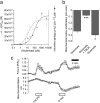
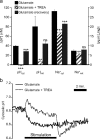
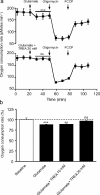
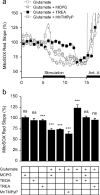
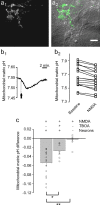
During synaptic activity, the clearance of neuronally released glutamate leads to an intracellular sodium concentration increase in astrocytes that is associated with significant metabolic cost. The proximity of mitochondria at glutamate uptake sites in astrocytes raises the question of the ability of mitochondria to respond to these energy demands. We used dynamic fluorescence imaging to investigate the impact of glutamatergic transmission on mitochondria in intact astrocytes. Neuronal release of glutamate induced an intracellular acidification in astrocytes, via glutamate transporters, that spread over the mitochondrial matrix. The glutamate-induced mitochondrial matrix acidification exceeded cytosolic acidification and abrogated cytosol-to-mitochondrial matrix pH gradient. By decoupling glutamate uptake from cellular acidification, we found that glutamate induced a pH-mediated decrease in mitochondrial metabolism that surpasses the Ca(2+)-mediated stimulatory effects. These findings suggest a model in which excitatory neurotransmission dynamically regulates astrocyte energy metabolism by limiting the contribution of mitochondria to the metabolic response, thereby increasing the local oxygen availability and preventing excessive mitochondrial reactive oxygen species production.
Figures

Similar articles
-
Extracellular Potassium and Glutamate Interact To Modulate Mitochondria in Astrocytes.ACS Chem Neurosci. 2018 Aug 15;9(8):2009-2015. doi: 10.1021/acschemneuro.8b00124. Epub 2018 May 15. ACS Chem Neurosci. 2018. PMID: 29741354
-
In situ fluorescence imaging of glutamate-evoked mitochondrial Na+ responses in astrocytes.Glia. 2006 Oct;54(5):460-70. doi: 10.1002/glia.20387. Glia. 2006. PMID: 16886210
-
L-glutamate decreases glucose utilization by rat cortical astrocytes.Neurosci Lett. 2003 Sep 11;348(2):81-4. doi: 10.1016/s0304-3940(03)00721-3. Neurosci Lett. 2003. PMID: 12902023
-
Glutamate Transporters and Mitochondria: Signaling, Co-compartmentalization, Functional Coupling, and Future Directions.Neurochem Res. 2020 Mar;45(3):526-540. doi: 10.1007/s11064-020-02974-8. Epub 2020 Jan 30. Neurochem Res. 2020. PMID: 32002773 Free PMC article. Review.
-
Cellular mechanisms of brain energy metabolism and their relevance to functional brain imaging.Philos Trans R Soc Lond B Biol Sci. 1999 Jul 29;354(1387):1155-63. doi: 10.1098/rstb.1999.0471. Philos Trans R Soc Lond B Biol Sci. 1999. PMID: 10466143 Free PMC article. Review.
Cited by
-
Unraveling the complex metabolic nature of astrocytes.Front Cell Neurosci. 2013 Oct 11;7:179. doi: 10.3389/fncel.2013.00179. Front Cell Neurosci. 2013. PMID: 24130515 Free PMC article. Review.
-
Animal Toxins as Therapeutic Tools to Treat Neurodegenerative Diseases.Front Pharmacol. 2018 Feb 23;9:145. doi: 10.3389/fphar.2018.00145. eCollection 2018. Front Pharmacol. 2018. PMID: 29527170 Free PMC article. Review.
-
Lactate-carried Mitochondrial Energy Overflow.bioRxiv [Preprint]. 2024 Jul 20:2024.07.19.604361. doi: 10.1101/2024.07.19.604361. bioRxiv. 2024. PMID: 39071354 Free PMC article. Preprint.
-
pH-Channeling in Cancer: How pH-Dependence of Cation Channels Shapes Cancer Pathophysiology.Cancers (Basel). 2020 Sep 2;12(9):2484. doi: 10.3390/cancers12092484. Cancers (Basel). 2020. PMID: 32887220 Free PMC article. Review.
-
Structural Insights into the Human Mitochondrial Pyruvate Carrier Complexes.J Chem Inf Model. 2021 Nov 22;61(11):5614-5625. doi: 10.1021/acs.jcim.1c00879. Epub 2021 Oct 19. J Chem Inf Model. 2021. PMID: 34664967 Free PMC article.
References
-
- Abad MF, Di Benedetto G, Magalhães PJ, Filippin L, Pozzan T. Mitochondrial pH monitored by a new engineered green fluorescent protein mutant. J Biol Chem. 2004;279:11521–11529. - PubMed
-
- Alle H, Roth A, Geiger JR. Energy-efficient action potentials in hippocampal mossy fibers. Science. 2009;325:1405–1408. - PubMed
-
- Amato A, Ballerini L, Attwell D. Intracellular pH changes produced by glutamate uptake in rat hippocampal slices. J Neurophysiol. 1994;72:1686–1696. - PubMed
-
- Balaban RS, Nemoto S, Finkel T. Mitochondria, oxidants, and aging. Cell. 2005;120:483–495. - PubMed
-
- Bernardi P. Mitochondrial transport of cations: channels, exchangers, and permeability transition. Physiol Rev. 1999;79:1127–1155. - PubMed
Publication types
MeSH terms
Substances
LinkOut - more resources
Full Text Sources
Miscellaneous
