

Multinational, observational study of procalcitonin in ICU patients with pneumonia requiring mechanical ventilation: a multicenter observational study
- PMID: 21385367
- PMCID: PMC3219347
- DOI: 10.1186/cc10087
Multinational, observational study of procalcitonin in ICU patients with pneumonia requiring mechanical ventilation: a multicenter observational study
Abstract
Introduction: The intent of this study was to determine whether serum procalcitonin (PCT) levels are associated with prognosis, measured as organ dysfunctions and 28-day mortality, in patients with severe pneumonia.
Methods: This was a multicenter, observational study of critically ill adult patients with pneumonia requiring mechanical ventilation conducted in 10 academic hospitals in Canada, the United States, and Central Europe. PCT was measured daily for 14 days using an immuno-luminometric assay.
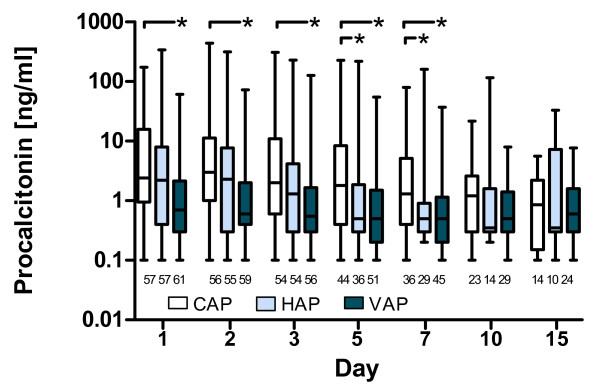
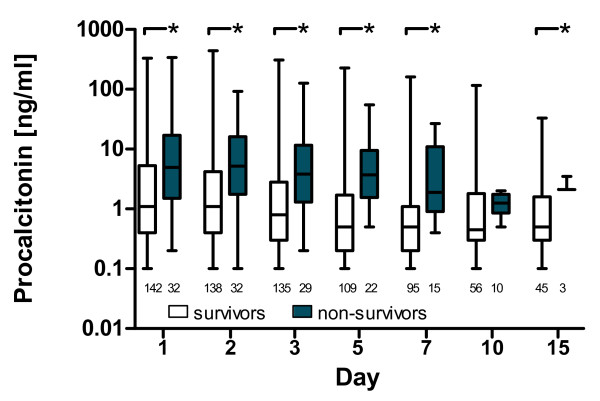
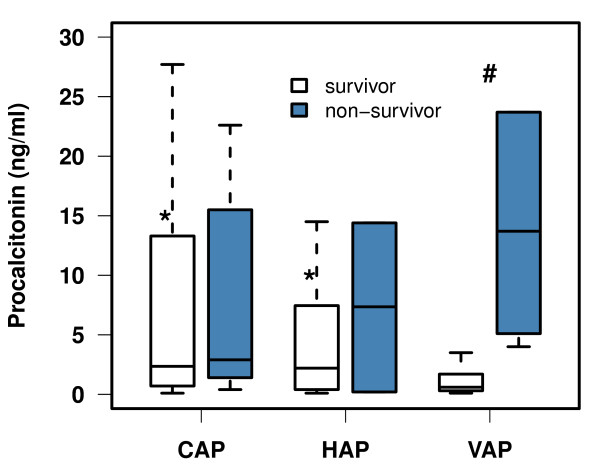
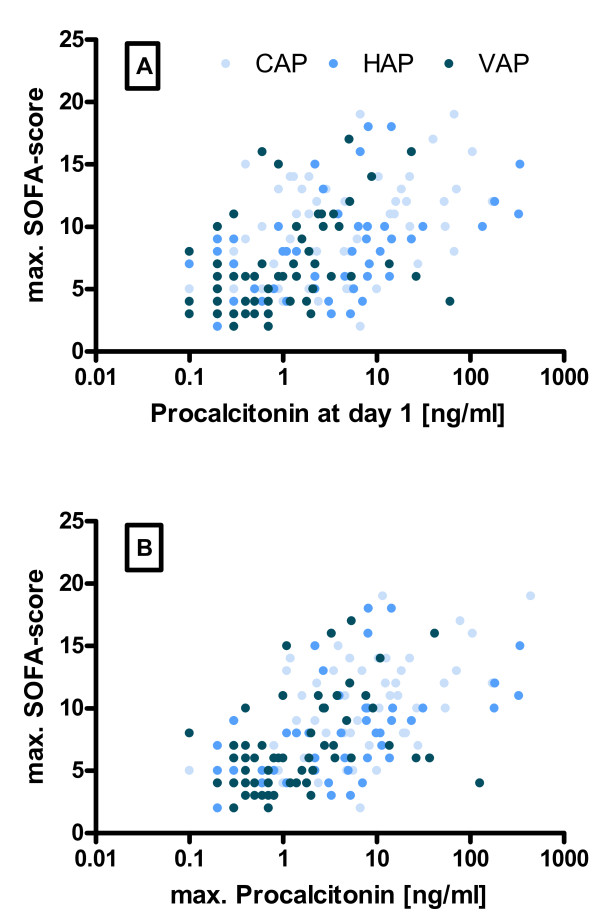
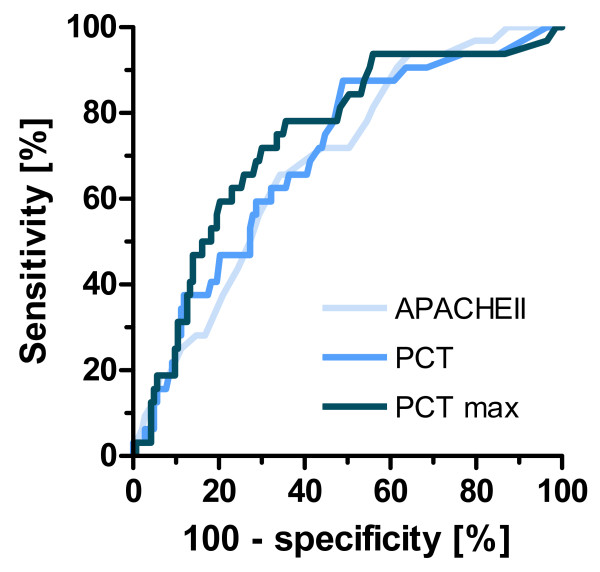
Results: We included 175 patients, 57 with community acquired pneumonia (CAP), 61 with ventilator associated pneumonia (VAP) and 57 with hospital acquired pneumonia (HAP). Initial PCT levels were higher in CAP than VAP patients (median (interquartile range: IQR); 2.4 (0.95 to 15.8) vs. 0.7 (0.3 to 2.15), ng/ml, P < 0.001) but not significantly different to HAP (2.2 (0.4 to 8.0) ng/ml). The 28-day ICU mortality rate for all patients was 18.3% with a median ICU length of stay of 16 days (range 1 to 142 days). PCT levels were higher in non-survivors than in survivors. Initial and maximum PCT levels correlated with maximum Sequential Organ Failure Assessment (SOFA) score r2 = 0.50 (95% CI: 0.38 to 0.61) and r² = 0.57 (0.46 to 0.66), respectively. Receiver operating curve (ROC) analysis on discrimination of 28-day mortality showed areas under the curve (AUC) of 0.74, 0.70, and 0.69 for maximum PCT, initial PCT, and Acute Physiology and Chronic Health Evaluation (APACHE) II score, respectively. The optimal cut-off to predict mortality for initial PCT was 1.1 ng/ml (odds ratio: OD 7.0 (95% CI 2.6 to 25.2)) and that for maximum PCT was 7.8 ng/ml (odds ratio 5.7 (95% CI 2.5 to 13.1)).
Conclusions: PCT is associated with the severity of illness in patients with severe pneumonia and appears to be a prognostic marker of morbidity and mortality comparable to the APACHE II score.
Figures
Similar articles
-
Can we predict pneumococcal bacteremia in patients with severe community-acquired pneumonia?J Crit Care. 2013 Dec;28(6):970-4. doi: 10.1016/j.jcrc.2013.04.016. J Crit Care. 2013. PMID: 24216331
-
Role of combined procalcitonin and lipopolysaccharide-binding protein as prognostic markers of mortality in patients with ventilator-associated pneumonia.Acta Med Indones. 2013 Apr;45(2):89-93. Acta Med Indones. 2013. PMID: 23770787 Clinical Trial.
-
Prognostic value of procalcitonin in pneumonia: A systematic review and meta-analysis.Respirology. 2016 Feb;21(2):280-8. doi: 10.1111/resp.12704. Epub 2015 Dec 10. Respirology. 2016. PMID: 26662169 Free PMC article. Review.
-
[Diagnostic value of HBP, PCT combined with APACHE Ⅱ score respectively in ventilator-associated pneumonia].Zhonghua Yi Xue Za Zhi. 2019 Jun 11;99(22):1698-1702. doi: 10.3760/cma.j.issn.0376-2491.2019.22.003. Zhonghua Yi Xue Za Zhi. 2019. PMID: 31216814 Chinese.
-
The role of procalcitonin in adult patients with community-acquired pneumonia--a systematic review.Dan Med J. 2012 Mar;59(3):A4357. Dan Med J. 2012. PMID: 22381083 Review.
Cited by
-
Procalcitonin: Where Are We Now?Crit Care Clin. 2020 Jan;36(1):23-40. doi: 10.1016/j.ccc.2019.08.003. Epub 2019 Oct 21. Crit Care Clin. 2020. PMID: 31733680 Free PMC article. Review.
-
Assessment of mechanisms of infectious pneumonia based on expression of fibrinogen, procalcitonin, high-sensitivity C-reactive protein expression, T helper 17 cells, regulatory T cells interleukin-10, and interleukin-17.Transl Pediatr. 2022 Jan;11(1):73-84. doi: 10.21037/tp-21-565. Transl Pediatr. 2022. PMID: 35242653 Free PMC article.
-
Clinico-bacterial and prognostic factors in patients with suspected blood stream infection and elevated serum procalcitonin levels.Nagoya J Med Sci. 2022 May;84(2):230-246. doi: 10.18999/nagjms.84.2.230. Nagoya J Med Sci. 2022. PMID: 35967939 Free PMC article.
-
Rapid diagnosis of sepsis.Virulence. 2014 Jan 1;5(1):154-60. doi: 10.4161/viru.27393. Epub 2013 Dec 11. Virulence. 2014. PMID: 24335467 Free PMC article. Review.
-
A novel procalcitonin-based score for detecting sepsis among critically ill patients.PLoS One. 2021 Jan 22;16(1):e0245748. doi: 10.1371/journal.pone.0245748. eCollection 2021. PLoS One. 2021. PMID: 33481913 Free PMC article.
References
-
- Alberti C, Brun-Buisson C, Goodman SV, Guidici D, Granton J, Moreno R, Smithies M, Thomas O, Artigas A, Le Gall JR. Influence of systemic inflammatory response syndrome and sepsis on outcome of critically ill infected patients. Am J Respir Crit Care Med. 2003;168:77–84. doi: 10.1164/rccm.200208-785OC. - DOI - PubMed
-
- Vincent JL, Bihari DJ, Suter PM, Bruining HA, White J, Nicolas-Chanoin MH, Wolff M, Spencer RC, Hemmer M. The prevalence of nosocomial infection in intensive care units in Europe. Results of the European Prevalence of Infection in Intensive Care (EPIC) Study. EPIC International Advisory Committee. JAMA. 1995;274:639–644. doi: 10.1001/jama.274.8.639. - DOI - PubMed
-
- Angus DC, Marrie TJ, Obrosky DS, Clermont G, Dremsizov TT, Coley C, Fine MJ, Singer DE, Kapoor WN. Severe community-acquired pneumonia: use of intensive care services and evaluation of American and British Thoracic Society Diagnostic criteria. Am J Respir Crit Care Med. 2002;166:717–723. doi: 10.1164/rccm.2102084. - DOI - PubMed
Publication types
MeSH terms
Substances
LinkOut - more resources
Full Text Sources
Medical
Miscellaneous
