

An NK and T cell enhancer lies 280 kilobase pairs 3' to the gata3 structural gene
- PMID: 21383068
- PMCID: PMC3133233
- DOI: 10.1128/MCB.05065-11
An NK and T cell enhancer lies 280 kilobase pairs 3' to the gata3 structural gene
Abstract
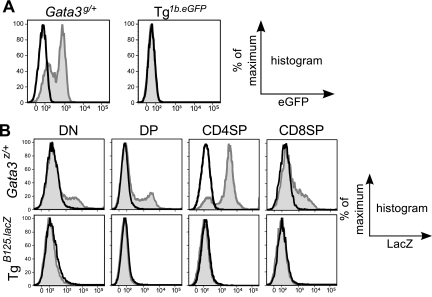
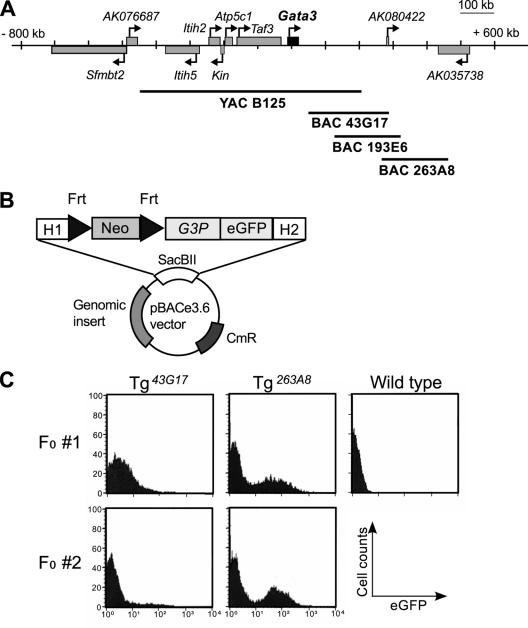
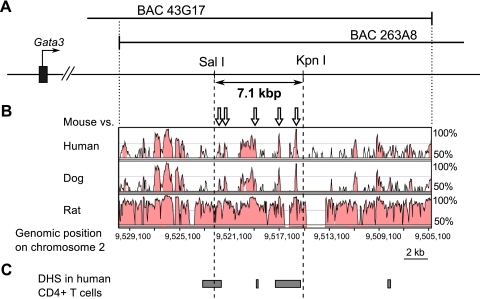
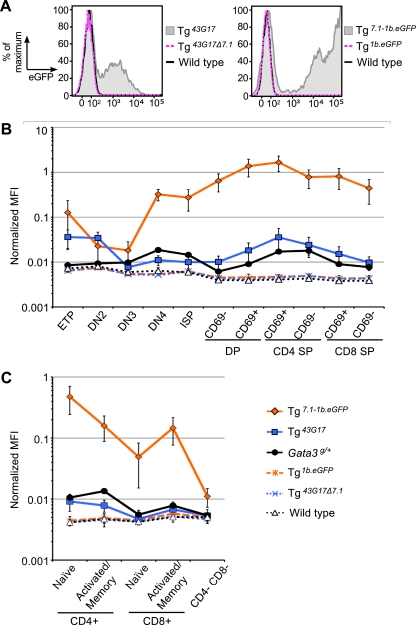
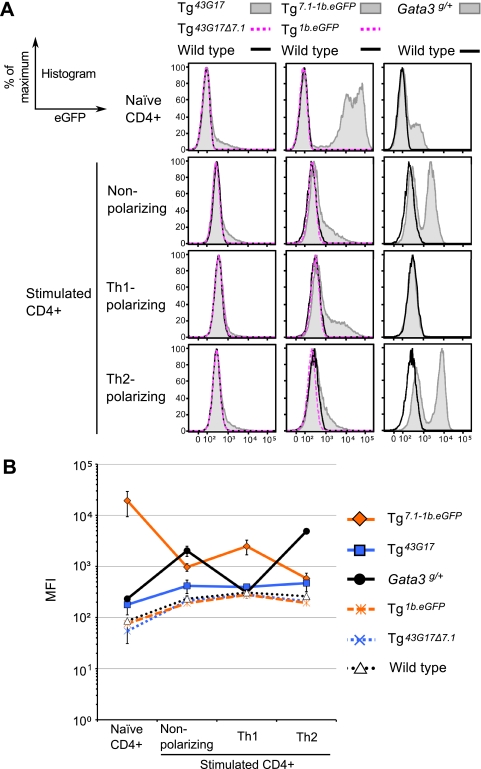
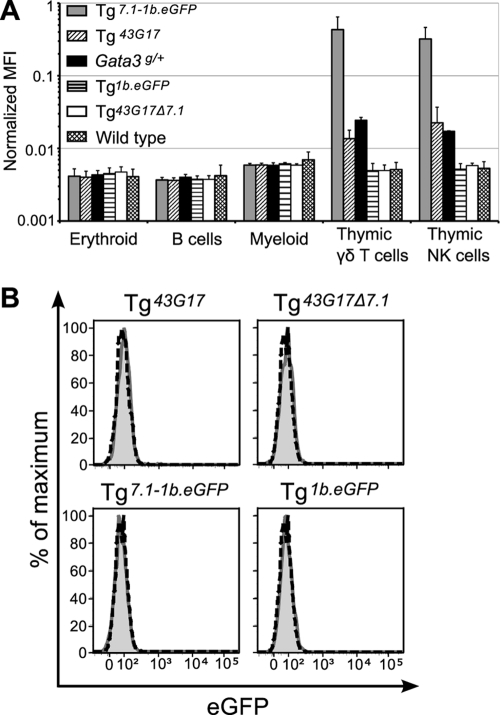
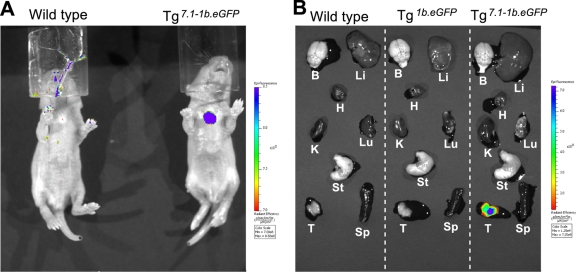
Transcription factor GATA-3 is vital for multiple stages of T cell and natural killer (NK) cell development, and yet the factors that directly regulate Gata3 transcription during hematopoiesis are only marginally defined. Here, we show that neither of the Gata3 promoters, previously implicated in its tissue-specific regulation, is alone capable of directing Gata3 transcription in T lymphocytes. In contrast, by surveying large swaths of DNA surrounding the Gata3 locus, we located a cis element that can recapitulate aspects of the Gata3-dependent T cell regulatory program in vivo. This element, located 280 kbp 3' to the structural gene, directs both T cell- and NK cell-specific transcription in vivo but harbors no other tissue activity. This novel, distant element regulates multiple major developmental stages that require GATA-3 activity.
Figures
Similar articles
-
Lineage-affiliated transcription factors bind the Gata3 Tce1 enhancer to mediate lineage-specific programs.J Clin Invest. 2016 Mar 1;126(3):865-78. doi: 10.1172/JCI83894. Epub 2016 Jan 25. J Clin Invest. 2016. PMID: 26808502 Free PMC article.
-
Dosage-dependent rescue of definitive nephrogenesis by a distant Gata3 enhancer.Dev Biol. 2007 Jan 15;301(2):568-77. doi: 10.1016/j.ydbio.2006.09.030. Epub 2006 Sep 22. Dev Biol. 2007. PMID: 17046739 Free PMC article.
-
Novel, Non-Gene-Destructive Knock-In Reporter Mice Refute the Concept of Monoallelic Gata3 Expression.J Immunol. 2020 May 1;204(9):2600-2611. doi: 10.4049/jimmunol.2000025. Epub 2020 Mar 25. J Immunol. 2020. PMID: 32213568 Free PMC article.
-
Transcriptional regulation of T lymphocyte development and function.Annu Rev Immunol. 1999;17:149-87. doi: 10.1146/annurev.immunol.17.1.149. Annu Rev Immunol. 1999. PMID: 10358756 Review.
-
An updated view on transcription factor GATA3-mediated regulation of Th1 and Th2 cell differentiation.Int Immunol. 2011 Jul;23(7):415-20. doi: 10.1093/intimm/dxr029. Epub 2011 Jun 1. Int Immunol. 2011. PMID: 21632975 Free PMC article. Review.
Cited by
-
A far downstream enhancer for murine Bcl11b controls its T-cell specific expression.Blood. 2013 Aug 8;122(6):902-11. doi: 10.1182/blood-2012-08-447839. Epub 2013 Jun 5. Blood. 2013. PMID: 23741008 Free PMC article.
-
Core transcriptional regulatory circuit controlled by the TAL1 complex in human T cell acute lymphoblastic leukemia.Cancer Cell. 2012 Aug 14;22(2):209-21. doi: 10.1016/j.ccr.2012.06.007. Cancer Cell. 2012. PMID: 22897851 Free PMC article.
-
Bcl11b, a novel GATA3-interacting protein, suppresses Th1 while limiting Th2 cell differentiation.J Exp Med. 2018 May 7;215(5):1449-1462. doi: 10.1084/jem.20171127. Epub 2018 Mar 7. J Exp Med. 2018. PMID: 29514917 Free PMC article.
-
Gata3 Hypomorphic Mutant Mice Rescued with a Yeast Artificial Chromosome Transgene Suffer a Glomerular Mesangial Cell Defect.Mol Cell Biol. 2016 Aug 12;36(17):2272-81. doi: 10.1128/MCB.00173-16. Print 2016 Sep 1. Mol Cell Biol. 2016. PMID: 27296697 Free PMC article.
-
Transcriptional repression of Gata3 is essential for early B cell commitment.Immunity. 2013 May 23;38(5):930-42. doi: 10.1016/j.immuni.2013.01.014. Epub 2013 May 16. Immunity. 2013. PMID: 23684985 Free PMC article.
References
-
- Reference deleted.
-
- Anderson M. K., et al. 2002. Definition of regulatory network elements for T cell development by perturbation analysis with PU.1 and GATA-3. Dev. Biol. 246:103–121 - PubMed
-
- Asnagli H., Afkarian M., Murphy K. M. 2002. Cutting edge: identification of an alternative GATA-3 promoter directing tissue-specific gene expression in mouse and human. J. Immunol. 168:4268–4271 - PubMed
-
- Asselin-Labat M.-L., et al. 2007. Gata-3 is an essential regulator of mammary-gland morphogenesis and luminal-cell differentiation. Nat. Cell Biol. 9:201–209 - PubMed
Publication types
MeSH terms
Substances
Grants and funding
LinkOut - more resources
Full Text Sources
Other Literature Sources
Molecular Biology Databases