. 2010 Sep 2;1(9):e69.
doi: 10.1038/cddis.2010.48.

Apoptosis of human melanoma cells induced by inhibition of B-RAFV600E involves preferential splicing of bimS

Affiliations

Apoptosis of human melanoma cells induced by inhibition of B-RAFV600E involves preferential splicing of bimS

C C Jiang et al. Cell Death Dis. .

Abstract

Bim is known to be critical in killing of melanoma cells by inhibition of the RAF/MEK/ERK pathway. However, the potential role of the most potent apoptosis-inducing isoform of Bim, Bim(S), remains largely unappreciated. Here, we show that inhibition of the mutant B-RAF(V600E) triggers preferential splicing to produce Bim(S), which is particularly important in induction of apoptosis in B-RAF(V600E) melanoma cells. Although the specific B-RAF(V600E) inhibitor PLX4720 upregulates all three major isoforms of Bim, Bim(EL), Bim(L), and Bim(S), at the protein and mRNA levels in B-RAF(V600E) melanoma cells, the increase in the ratios of Bim(S) mRNA to Bim(EL) and Bim(L) mRNA indicates that it favours Bim(S) splicing. Consistently, enforced expression of B-RAF(V600E) in wild-type B-RAF melanoma cells and melanocytes inhibits Bim(S) expression. The splicing factor SRp55 appears necessary for the increase in Bim(S) splicing, as SRp55 is upregulated, and its inhibition by small interfering RNA blocks induction of Bim(S) and apoptosis induced by PLX4720. The PLX4720-induced, SRp55-mediated increase in Bim(S) splicing is also mirrored in freshly isolated B-RAF(V600E) melanoma cells. These results identify a key mechanism for induction of apoptosis by PLX4720, and are instructive for sensitizing melanoma cells to B-RAF(V600E) inhibitors.


Figures
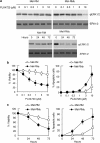
Figure 1
Figure 1
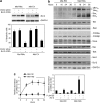
PLX4720 inhibits proliferation and induces apoptosis in mutant B-RAF melanoma cells. (a) Whole cell lysates from Mel-RM (wild-type B-RAF) and Mel-RMu (B-RAFV600E) cells treated with PLX4720 at indicated concentrations for 72 h (upper panel) or at 10 μM for indicated periods (lower panel), were subjected to western blot analysis of phosphorylated ERK1/2 and ERK1/2. (b) Mel-RM and Mel-RMu cells were treated with PLX4720 at indicated concentrations for 72 h. Cell viability (left panel) and apoptosis (right panel) were quantitated by the MTS assay and propidium iodide (PI) method, respectively. The data shown are the mean±S.E. of three individual experiments. (c) Mel-RM and Mel-RMu cells were treated with PLX4720 at 10 μM for indicated periods. Cell viability (left panel) and apoptosis (right panel) were quantitated by the MTS assay and PI method, respectively. The data shown are the mean±S.E. of three individual experiments. (d) A summary of the effect of PLX4720 on cell survival in a panel of mutant and wild-type B-RAF melanoma cell lines. Cells treated with PLX4720 at 10 μM for 72 h were subjected to MTS assays. The data shown are the mean±S.E. of three individual experiments. (e) Left panel: B-RAFV600E Mel-RMu and Mel-CV cells were transfected with the control or B-RAF siRNA. After 24 h, whole cell lysates were subjected to western blot analysis of B-RAF, phosphorylated ERK1/2, and ERK1/2. Western blot analysis of A-RAF and C-RAF was included as controls to show the specificity of the B-RAF siRNA. Right panel: Mel-RMu and Mel-CV cells were transfected with the control or B-RAF siRNA. After 24 h, cells were treated with PLX4720 (10 μM) for a further 72 h. Apoptotic cells were measured by the PI method. The data shown are either representative (left panel), or the mean±S.E. (right panel), of three individual experiments
Figure 1
Figure 1
PLX4720 inhibits proliferation and induces apoptosis in mutant B-RAF melanoma cells. (a) Whole cell lysates from Mel-RM (wild-type B-RAF) and Mel-RMu (B-RAFV600E) cells treated with PLX4720 at indicated concentrations for 72 h (upper panel) or at 10 μM for indicated periods (lower panel), were subjected to western blot analysis of phosphorylated ERK1/2 and ERK1/2. (b) Mel-RM and Mel-RMu cells were treated with PLX4720 at indicated concentrations for 72 h. Cell viability (left panel) and apoptosis (right panel) were quantitated by the MTS assay and propidium iodide (PI) method, respectively. The data shown are the mean±S.E. of three individual experiments. (c) Mel-RM and Mel-RMu cells were treated with PLX4720 at 10 μM for indicated periods. Cell viability (left panel) and apoptosis (right panel) were quantitated by the MTS assay and PI method, respectively. The data shown are the mean±S.E. of three individual experiments. (d) A summary of the effect of PLX4720 on cell survival in a panel of mutant and wild-type B-RAF melanoma cell lines. Cells treated with PLX4720 at 10 μM for 72 h were subjected to MTS assays. The data shown are the mean±S.E. of three individual experiments. (e) Left panel: B-RAFV600E Mel-RMu and Mel-CV cells were transfected with the control or B-RAF siRNA. After 24 h, whole cell lysates were subjected to western blot analysis of B-RAF, phosphorylated ERK1/2, and ERK1/2. Western blot analysis of A-RAF and C-RAF was included as controls to show the specificity of the B-RAF siRNA. Right panel: Mel-RMu and Mel-CV cells were transfected with the control or B-RAF siRNA. After 24 h, cells were treated with PLX4720 (10 μM) for a further 72 h. Apoptotic cells were measured by the PI method. The data shown are either representative (left panel), or the mean±S.E. (right panel), of three individual experiments
Figure 2
Figure 2
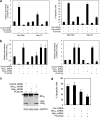
PLX4720 upregulates Bim. (a) Upper panel: overexpression of Bcl-2 in Mel-RMu and Mel-CV cells stably transfected with cDNA encoding Bcl-2. Whole cell lysates were subjected to western blot analysis of Bcl-2 and GAPDH (as a loading control). Lower panel: Mel-RMu and Mel-CV cells overexpressing Bcl-2 were treated with PLX4720 (10 μM) for 72 h before apoptosis was quantitated by the propidium iodide (PI) method. The data shown are either representative (upper panel) or mean±S.E. (lower panel) of three individual experiments. (b) Whole cell lysates from Mel-RM and Mel-RMu cells treated with PLX4720 (10 μM) for indicated time periods were subjected to western blot analysis of Bim, Bid, PUMA, Noxa, Bax, Bak, Mcl-1, Bcl-2, and GAPDH (as a loading control). The data shown are representative of three individual western blot analyses. (c) Left panel: total RNA from Mel-RM and Mel-RMu cells treated with PLX4720 (10 μM) for indicated time periods was isolated and subjected to real-time PCR analysis for Bim mRNA expression. The relative abundance of mRNA expression before treatment was arbitrarily designated as 1. Right panel: total RNA from Mel-RM and Mel-RMu cells treated with PLX4720 (10 μM) for 16 h with or without pretreatment with actinomycin D (Act-D) (3 μg/ml) for 1 h were subjected to real-time PCR analysis. The relative abundance of mRNA expression before treatment was arbitrarily designated as 1. The data shown are the mean±S.E. of three individual experiments
Figure 3
Figure 3
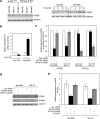
PLX4720 preferentially increases splicing to produce BimS. (a) Total RNA from Mel-RMu cells treated with PLX4720 (10 μM) for 16 h was subjected to real-time PCR analysis for BimEL, BimL, and BimS mRNA expression. The levels of the expression of individual species before treatment were arbitrarily designated as 1. The data shown are the mean±S.E. of three individual experiments. (b) Total RNA from Mel-RMu cells treated with PLX4720 (10 μM) for 16 h was subjected to BimEL, BimL, and BimS mRNA expression as in a. Left panel: the ratios between the levels of BimS mRNA and BimEL mRNA before and after treatment, respectively, were calculated as (ΔΔCt of BimS/ΔΔCt of BimEL). Right panel: the ratios between the levels of BimS mRNA and BimL mRNA before and after treatment, respectively, were calculated as (ΔΔCt of BimS/ΔΔCt of BimL). The data shown are the mean±S.E. of three individual experiments. (c) Upper panel: total RNA from Mel-RM and Mel-RMu cells treated with SBHA (10 μg/ml) for 16 h were subjected to real-time PCR analysis for Bim mRNA expression. The relative abundance of mRNA expression before treatment was arbitrarily designated as 1. Lower panel: whole cell lysates from cells treated as above were subjected to western blot analysis of Bim and GAPDH (as a loading control). The strong band denoted by the arrowhead is nonspecific, and was associated with the particular batch of the antibody against Bim used in the experiment. The data shown are either representative (lower panel) or the mean±S.E. (upper panel) of three individual experiments. (d) Total RNA from Mel-RM and Mel-RMu cells treated with SBHA (10 μg/ml) for 16 h were subjected to real-time PCR analysis for BimEL, BimL, and BimS mRNA expression. The ratios of BimS mRNA to BimEL and BimL mRNA before and after treatment, respectively, were calculated as in b. The data shown are the mean±S.E. of three individual experiments
Figure 4
Figure 4
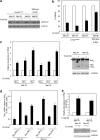
Enforced expression of B-RAFV600E inhibited BimS expression in wild-type B-RAF melanoma cells and melanocytes. (a) Mel-RM and Me1007 cells were stably transfected with cDNA encoding B-RAF carrying the V600E mutation. Whole cell lysates were subjected to western blot analysis of B-RAF, pERK1/2, and ERK1/2. The data shown are representative of three individual western blot analyses. (b) Mel-RM and Me1007 cells were stably transfected with cDNA encoding B-RAF carrying the V600E mutation. Cells were treated with SBHA (10 μg/ml) for a further 16 h. Total RNA was isolated and subjected to real-time PCR analysis for BimEL, BimL, and BimS mRNA expression. The levels of the expression of individual species before treatment were arbitrarily designated as 1. The data shown are the mean±S.E. of three individual experiments. (c) Whole cell lysates from Mel-RM and Me1007 cells treated as in b were subjected to western blot analysis of Bim and GAPDH (as a loading control). The arrowhead points to nonspecific bands. The data shown are representative of three individual western blot analyses. (d) Melanocytes were transiently transfected with cDNA encoding B-RAF carrying the V600E mutation. After 24 h, whole cell lysates were subjected to western blot analysis of B-RAF, pERK1/2, ERK1/2, Bim, and Bcl-2. The arrowhead points to nonspecific bands. The data shown are representative of three individual western blot analyses
Figure 5
Figure 5
BimS has a critical role in PLX4720-induced apoptosis of mutant B-RAF melanoma cells. (a) Left panel: Mel-RMu and Mel-CV cells (B-RAFV600E) were transfected with the control or Bim siRNA. After 24 h, cells were treated with PLX4720 for 16 h. Total RNA was isolated and subjected to real-time PCR analysis for Bim mRNA expression. The relative abundance of mRNA expression in cells transfected with the control siRNA before treatment was arbitrarily designated as 1. Right panel: Mel-RMu and Mel-CV cells were transfected with the control or Bim siRNA. After 24 h, cells were treated with PLX4720 for a further 72 h. Apoptosis was quantitated by the propidium iodide (PI) method. The data shown are the mean±S.E. of three individual experiments. (b) Mel-RMu cells were transfected with the control, BimEL, or BimS siRNA. After 24 h, cells were treated with PLX4720 (10 μM) for 16 h. Total RNA was isolated and subjected to real-time PCR analysis for BimEL (left panel) and BimS (right panel) mRNA expression. The levels of the expression of individual species in cells transfected with the control siRNA without treatment were arbitrarily designated as 1. The data shown are the mean±S.E. of three individual experiments. (c) Whole cell lysates from Mel-RMu cells treated as in b were subjected to western blot analysis of Bim and GAPDH (as a loading control). The arrowhead points to nonspecific bands. The data shown are representative of three individual western blot analyses. (d) Mel-RMu cells with BimEL or BimS knocked down as in b were treated with PLX 4720 at 10 μM for 72 h. Apoptosis was quantitated by the PI method. The data shown are the mean±S.E. of three individual experiments. (e) Left panel: Mel-RMu and Mel-CV cells were transfected with pCMV6-AC-GFP or pCMV6-AC-BimS-GFP. After 24 h, whole cell lysates were subjected to western blot analysis of BimS-GFP using an antibody against GFP. Western blot analysis of GAPDH was then performed as a loading control. Right panel: Mel-RMu and Mel-CV cells were transfected with pCMV6-AC-GFP or pCMV6-AC-BimS-GFP. After 24 h, mitochondrial fractions were subjected to western blot analysis of BimS-GFP using an antibody against GFP. Western blot analysis of COX IV was then performed as a loading control. (f) Left panel: Representative flow cytometric histograms of measurement of apoptosis using PE-conjugated Annexin-V in Mel-RMu and Mel-CV cells transfected with pCMV6-AC-GFP or pCMV6-AC-BimS-GFP. PE-positive cells were quantitated in gated GFP-positive cell populations. The numbers represent percentages of positive cells. Right panel: Mel-RMu and Mel-CV cells were transfected with pCMV6-AC-GFP or pCMV6-AC-BimS-GFP for indicated time periods. Apoptotic cells were quantitated with PE-conjugated Annexin-V in gated GFP-positive cell populations. The data shown are representative of two experiments. (g) Mitochondrial fractions from Mel-RMu and Mel-CV cells treated with PLX4720 (10 μM) for indicated time periods were subjected to western blot analysis of Bim and COX IV (as a control). The data shown are representative of three individual western blot analyses
Figure 5
Figure 5
BimS has a critical role in PLX4720-induced apoptosis of mutant B-RAF melanoma cells. (a) Left panel: Mel-RMu and Mel-CV cells (B-RAFV600E) were transfected with the control or Bim siRNA. After 24 h, cells were treated with PLX4720 for 16 h. Total RNA was isolated and subjected to real-time PCR analysis for Bim mRNA expression. The relative abundance of mRNA expression in cells transfected with the control siRNA before treatment was arbitrarily designated as 1. Right panel: Mel-RMu and Mel-CV cells were transfected with the control or Bim siRNA. After 24 h, cells were treated with PLX4720 for a further 72 h. Apoptosis was quantitated by the propidium iodide (PI) method. The data shown are the mean±S.E. of three individual experiments. (b) Mel-RMu cells were transfected with the control, BimEL, or BimS siRNA. After 24 h, cells were treated with PLX4720 (10 μM) for 16 h. Total RNA was isolated and subjected to real-time PCR analysis for BimEL (left panel) and BimS (right panel) mRNA expression. The levels of the expression of individual species in cells transfected with the control siRNA without treatment were arbitrarily designated as 1. The data shown are the mean±S.E. of three individual experiments. (c) Whole cell lysates from Mel-RMu cells treated as in b were subjected to western blot analysis of Bim and GAPDH (as a loading control). The arrowhead points to nonspecific bands. The data shown are representative of three individual western blot analyses. (d) Mel-RMu cells with BimEL or BimS knocked down as in b were treated with PLX 4720 at 10 μM for 72 h. Apoptosis was quantitated by the PI method. The data shown are the mean±S.E. of three individual experiments. (e) Left panel: Mel-RMu and Mel-CV cells were transfected with pCMV6-AC-GFP or pCMV6-AC-BimS-GFP. After 24 h, whole cell lysates were subjected to western blot analysis of BimS-GFP using an antibody against GFP. Western blot analysis of GAPDH was then performed as a loading control. Right panel: Mel-RMu and Mel-CV cells were transfected with pCMV6-AC-GFP or pCMV6-AC-BimS-GFP. After 24 h, mitochondrial fractions were subjected to western blot analysis of BimS-GFP using an antibody against GFP. Western blot analysis of COX IV was then performed as a loading control. (f) Left panel: Representative flow cytometric histograms of measurement of apoptosis using PE-conjugated Annexin-V in Mel-RMu and Mel-CV cells transfected with pCMV6-AC-GFP or pCMV6-AC-BimS-GFP. PE-positive cells were quantitated in gated GFP-positive cell populations. The numbers represent percentages of positive cells. Right panel: Mel-RMu and Mel-CV cells were transfected with pCMV6-AC-GFP or pCMV6-AC-BimS-GFP for indicated time periods. Apoptotic cells were quantitated with PE-conjugated Annexin-V in gated GFP-positive cell populations. The data shown are representative of two experiments. (g) Mitochondrial fractions from Mel-RMu and Mel-CV cells treated with PLX4720 (10 μM) for indicated time periods were subjected to western blot analysis of Bim and COX IV (as a control). The data shown are representative of three individual western blot analyses
Figure 6
Figure 6
SRp55 has a role in upregulation of BimS by PLX4720. (a) Left panel: whole cell lysates from a panel of mutant and wild-type B-RAF melanoma cell lines were subjected to western blot analysis of SRp55 and GAPDH (as a loading control). Right panel: whole cell lysates from Mel-RM and Mel-RMu cells treated with PLX4720 (10 μM) for indicated time periods were subjected to western blot analysis of SRp55 and GAPDH (as a loading control). The data shown are representative of three individual western blot analyses. (b) Total RNA from Mel-RM and Mel-RMu cells treated with PLX4720 (10 μM) for 16 h was isolated and subjected to real-time PCR analysis for SFRS6. The relative abundance of mRNA expression before treatment was arbitrarily designated as 1. The data shown are the mean±S.E. of three individual experiments. (c) Mutant B-RAF Mel-RMu and Mel-CV cells were transfected with the control, SFRS6, and SFRS12 siRNAs. After 24 h, total RNA was isolated and subjected to real-time PCR analysis for SFRS6 and SFRS12 mRNA expression. The relative abundance of mRNA expression in cells transfected with the control siRNA was arbitrarily designated as 1. The data shown are the mean±S.E. of three individual experiments. (d) Whole cell lysates from cells treated as in c were subjected to western blot analysis of SRp55, SRrp86, and GAPDH (as a loading control). The data shown are representative of three individual western blot analyses. (e) Mel-RMu and Mel-CV cells were transfected with the control, SFRS6, and SFRS12 siRNAs. After 24 h, cells were treated with PLX4720 (10 μM) for a further 16 h. Total RNA was isolated and subjected to real-time PCR analysis for BimS mRNA expression. The relative abundance of mRNA expression in cells transfected with the control siRNA without treatment with PLX4720 was arbitrarily designated as 1, which was not shown. The data shown are the mean±S.E. of three individual experiments. (f) Mel-RMu and Mel-CV cells were transfected with the control, SFRS6, and SFRS12 siRNA. After 24 h, total RNA was isolated and subjected to real-time PCR analysis for BimEL, BimL, and BimS mRNA expression. Left panel: the ratios between the levels of BimS mRNA and BimEL mRNA before and after treatment, respectively, were calculated as (ΔΔCt of BimS/ΔΔCt of BimEL). Right panel: the ratios between the levels of BimS mRNA and BimL mRNA before and after treatment, respectively, were calculated as (ΔΔCt of BimS/ΔΔCt of BimL). The data shown are the mean±S.E. of three individual experiments. (g) Mel-RMu and Mel-CV cells were transfected with the control and SFRS6 siRNA, respectively. After 24 h later, whole cell lysates were subjected to western blot analysis of Bim and GAPDH (as a loading control). The arrowhead points to nonspecific bands generated by the antibody against Bim. The data shown are representative of three individual western blot analyses. (h) Mel-RMu and Mel-CV cells were transfected with the control, SFRS6, and SFRS12 siRNA. After 24 h, cells were treated with PLX4720 (10 μM) for a further 72 h. Apoptosis was quantitated by the propidium iodide (PI) method. The data shown are the mean±S.E. of three individual experiments. (i) Left panel: Mel-Rmu and Mel-CV cells were transfected with with pCMV6-AC-GFP or pCMV6-AC-SFRS6-GFP. After 48 h, cells were harvested and apoptosis was measured with PE-conjugated Annexin-V in gated GFP-positive cell populations. The data shown are representative of two experiments. Right panel: Mel-Rmu and Mel-CV cells were transfected with with pCMV6-AC-GFP or pCMV6-AC-SFRS6-GFP. After 24 h, whole cell lysates were subjected to western blot analysis of SRp55-GFP and BimS. The arrowhead points to nonspecific bands. Western blot analysis of GAPDH was then performed as a loading control. The data shown are representative of three individual western blot analyses
Figure 6
Figure 6
SRp55 has a role in upregulation of BimS by PLX4720. (a) Left panel: whole cell lysates from a panel of mutant and wild-type B-RAF melanoma cell lines were subjected to western blot analysis of SRp55 and GAPDH (as a loading control). Right panel: whole cell lysates from Mel-RM and Mel-RMu cells treated with PLX4720 (10 μM) for indicated time periods were subjected to western blot analysis of SRp55 and GAPDH (as a loading control). The data shown are representative of three individual western blot analyses. (b) Total RNA from Mel-RM and Mel-RMu cells treated with PLX4720 (10 μM) for 16 h was isolated and subjected to real-time PCR analysis for SFRS6. The relative abundance of mRNA expression before treatment was arbitrarily designated as 1. The data shown are the mean±S.E. of three individual experiments. (c) Mutant B-RAF Mel-RMu and Mel-CV cells were transfected with the control, SFRS6, and SFRS12 siRNAs. After 24 h, total RNA was isolated and subjected to real-time PCR analysis for SFRS6 and SFRS12 mRNA expression. The relative abundance of mRNA expression in cells transfected with the control siRNA was arbitrarily designated as 1. The data shown are the mean±S.E. of three individual experiments. (d) Whole cell lysates from cells treated as in c were subjected to western blot analysis of SRp55, SRrp86, and GAPDH (as a loading control). The data shown are representative of three individual western blot analyses. (e) Mel-RMu and Mel-CV cells were transfected with the control, SFRS6, and SFRS12 siRNAs. After 24 h, cells were treated with PLX4720 (10 μM) for a further 16 h. Total RNA was isolated and subjected to real-time PCR analysis for BimS mRNA expression. The relative abundance of mRNA expression in cells transfected with the control siRNA without treatment with PLX4720 was arbitrarily designated as 1, which was not shown. The data shown are the mean±S.E. of three individual experiments. (f) Mel-RMu and Mel-CV cells were transfected with the control, SFRS6, and SFRS12 siRNA. After 24 h, total RNA was isolated and subjected to real-time PCR analysis for BimEL, BimL, and BimS mRNA expression. Left panel: the ratios between the levels of BimS mRNA and BimEL mRNA before and after treatment, respectively, were calculated as (ΔΔCt of BimS/ΔΔCt of BimEL). Right panel: the ratios between the levels of BimS mRNA and BimL mRNA before and after treatment, respectively, were calculated as (ΔΔCt of BimS/ΔΔCt of BimL). The data shown are the mean±S.E. of three individual experiments. (g) Mel-RMu and Mel-CV cells were transfected with the control and SFRS6 siRNA, respectively. After 24 h later, whole cell lysates were subjected to western blot analysis of Bim and GAPDH (as a loading control). The arrowhead points to nonspecific bands generated by the antibody against Bim. The data shown are representative of three individual western blot analyses. (h) Mel-RMu and Mel-CV cells were transfected with the control, SFRS6, and SFRS12 siRNA. After 24 h, cells were treated with PLX4720 (10 μM) for a further 72 h. Apoptosis was quantitated by the propidium iodide (PI) method. The data shown are the mean±S.E. of three individual experiments. (i) Left panel: Mel-Rmu and Mel-CV cells were transfected with with pCMV6-AC-GFP or pCMV6-AC-SFRS6-GFP. After 48 h, cells were harvested and apoptosis was measured with PE-conjugated Annexin-V in gated GFP-positive cell populations. The data shown are representative of two experiments. Right panel: Mel-Rmu and Mel-CV cells were transfected with with pCMV6-AC-GFP or pCMV6-AC-SFRS6-GFP. After 24 h, whole cell lysates were subjected to western blot analysis of SRp55-GFP and BimS. The arrowhead points to nonspecific bands. Western blot analysis of GAPDH was then performed as a loading control. The data shown are representative of three individual western blot analyses
Figure 7
Figure 7
PLX4720 inhibits activation of ERK1/2, reduces cell viability, upregulates BimS, increases the ratios of BimS mRNA to BimEL and BimL mRNA, and upregulates SRp55 in mutant B-RAF fresh melanoma isolates. (a) Whole cell lysates from fresh melanoma isolates harboring mutant B-RAF (Mel-JR, Mel-JG, and Mel-EK) or wild-type B-RAF (Mel-BE) treated with PLX4720 (10 μM) for 16 h were subjected to western blot analysis of pERK1/2 and ERK1/2. The data shown are representative of three individual western blot analyses. (b) Fresh melanoma isolates were treated with PLX4720 (10 μM) for 72 h before cell viability was quantitated by MTS assays. The data shown are the mean±S.E. of three individual experiments. (c) Left panel: freshly isolated Mel-JR and Mel-JG cells were treated with PLX4720 (10 μM) for 16 h. Total RNA was isolated and subjected to real-time PCR analysis for BimEL, BimL, and BimS mRNA expression. The levels of the expression of individual species before treatment were arbitrarily designated as 1. Right panel: whole cell lysates from freshly isolated Mel-JR and Mel-JG cells treated with PLX4720 (10 μM) for 16 h were subjected to western blot analysis of Bim and GAPDH (as a loading control). The arrowhead points to nonspecific bands. The data shown are either representative (right panel) or the mean±S.E. (left panel) of three individual experiments. (d) Freshly isolated Mel-JR and Mel-JG cells were treated with PLX4720 (10 μM) for 16 h. Total RNA was isolated and subjected to real-time PCR analysis for BimEL, BimL, and BimS mRNA expression. The ratios between the levels of BimS mRNA and BimEL mRNA before and after treatment, respectively, were calculated as (ΔΔCt of BimS/ΔΔCt of BimEL), and the ratios between the levels of BimS mRNA and BimL mRNA before and after treatment, respectively, were calculated as (ΔΔCt of BimS/ΔΔCt of BimL). The data shown are the mean±S.E. of three individual experiments. (e) Upper panel: total RNA from Mel-JR and Mel-JG cells treated with PLX4720 as in a was subjected to real-time PCR analysis for SFRS6 mRNA expression. The relative abundance of SFRS6 mRNA in cells before treatment was arbitrarily designated as 1. Lower panel: whole cell lysates from Mel-JR and Mel-JG cells treated as given above were subjected to western blot analysis of SRp55 and GAPDH (as a loading control). The data shown are either representative (lower panel) or the mean±S.E. (upper panel) of three individual experiments
Figure 8
Figure 8
Inhibition of BimS by siRNA reverses the reduction in cell viability induced by PLX4720, whereas inhibition of SRp55 blocks induction of BimS and induction of apoptosis by PLX4720 in mutant B-RAF fresh melanoma isolates. (a) Left panel: Mel-JR and Mel-JG cells were transfected with the control and BimS siRNA, respectively. After 24 h, whole cell lysates were subjected to western blot analysis of Bim and GAPDH (as a loading control). The arrowhead points to nonspecific bands. Right panel: Mel-JR and Mel-JG cells were transfected with the control and BimS siRNA, respectively. After 24 h, cells were treated with PLX4720 (10 μM) for a further 72 h. Apoptosis was measured by the propidium iodide (PI) method. The data shown are either representative (left panel) or the mean±S.E. (right panel) of three individual experiments. (b) Mel-JR and Mel-JG cells were transfected with the control and SFRS6 siRNA, respectively. After 24 h, cells were treated with PLX4720 (10 μM) for a further 16 h. Whole cell lysates were subjected to western blot analysis of SRp55, Bim, and GAPDH (as a loading control). The arrowhead points to nonspecific bands. The data shown are representative of three individual western blot analyses. (c) Total RNA from Mel-JR and Mel-JG cells treated as in b was subjected to real-time PCR analysis for BimS mRNA expression. The relative abundance of BimS mRNA in cells transfected with the control siRNA without treatment with PLX4720 was designated as 1, which was not shown. The data shown are the mean±S.E. of three individual experiments. (d) Mel-JR and Mel-JG cells were transfected with the control and SFRS6 siRNA, respectively. After 24 h, cells were treated with PLX4720 (10 μM) for a further 72 h. Apoptosis was quantitated by the PI method. The data shown are either the mean±S.E. (right panel of a, c, and d) or representative (left panel of a and b) of three individual experiments. The data shown are the mean±S.E. of three individual experiments

Similar articles

Cited by

References

    1. Flaherty KT, Puzanov I, Sosman J, Kim K, Ribas A, McArthur A, et al. Phase I study of PLX4032: Proof of concept for V600E BRAF mutation as a therapeutic target in human cancer J Clin Oncol 200927Abstract 9000.
    1. Chapman P, Puzanov I, Sosman J, Kim K, Ribas A, McArthur A, et al. Early efficacy signal demonstrated in advanced melanoma in a phase I trial of the oncogenic BRAF-selective inhibitor PLX4032. Eur J Cancer Suppl. 2009;7:5.
    1. Davies H, Bignell GR, Cox C, Stephens P, Edkins S, Clegg S, et al. Mutations of the BRAF gene in human cancer. Nature. 2002;417:949–954. - PubMed
    1. Platz A, Egyhazi S, Ringborg U, Hansson J. Human cutaneous melanoma; a review of NRAS and BRAF mutation frequencies in relation to histogenetic subclass and body site. Mol Oncol. 2008;1:395–405. - PMC - PubMed
    1. Wellbrock C, Rana S, Paterson H, Pickersgill H, Brummelkamp T, Marais R. Oncogenic BRAF regulates melanoma proliferation through the lineage specific factor MITF. PLoS One. 2008;3:e2734. - PMC - PubMed

Publication types

MeSH terms