. 2011 Feb 16;6(2):e14681.
doi: 10.1371/journal.pone.0014681.

Prediction of Associations between microRNAs and Gene Expression in Glioma Biology

Affiliations

Prediction of Associations between microRNAs and Gene Expression in Glioma Biology

Stefan Wuchty et al. PLoS One. .

Abstract

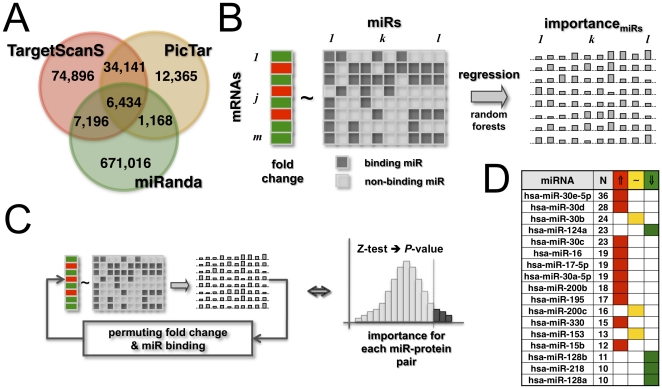
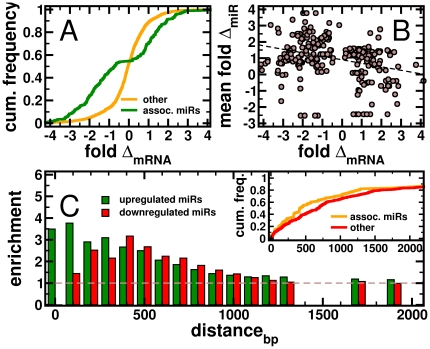
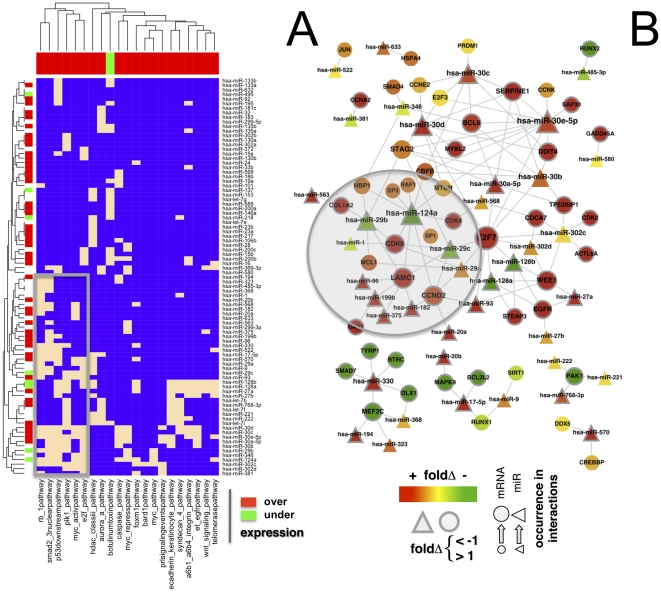
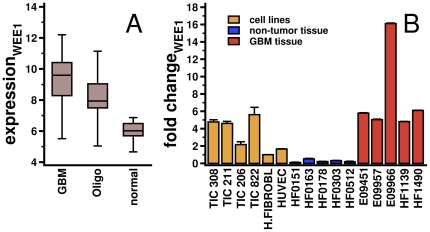
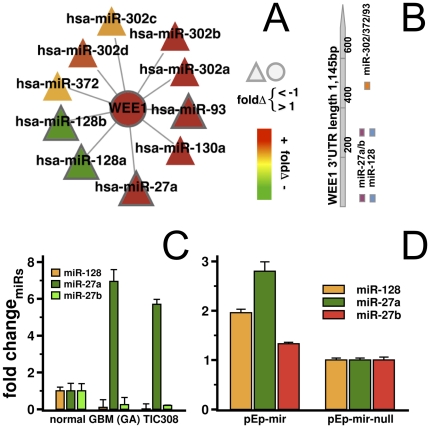
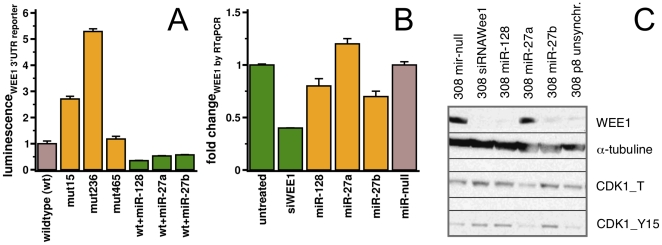
Despite progress in the determination of miR interactions, their regulatory role in cancer is only beginning to be unraveled. Utilizing gene expression data from 27 glioblastoma samples we found that the mere knowledge of physical interactions between specific mRNAs and miRs can be used to determine associated regulatory interactions, allowing us to identify 626 associated interactions, involving 128 miRs that putatively modulate the expression of 246 mRNAs. Experimentally determining the expression of miRs, we found an over-representation of over(under)-expressed miRs with various predicted mRNA target sequences. Such significantly associated miRs that putatively bind over-expressed genes strongly tend to have binding sites nearby the 3'UTR of the corresponding mRNAs, suggesting that the presence of the miRs near the translation stop site may be a factor in their regulatory ability. Our analysis predicted a significant association between miR-128 and the protein kinase WEE1, which we subsequently validated experimentally by showing that the over-expression of the naturally under-expressed miR-128 in glioma cells resulted in the inhibition of WEE1 in glioblastoma cells.


Conflict of interest statement

Competing Interests: The authors have declared that no competing interests exist.

Figures

Figure 1
Figure 1. Determination of significantly associated miRs.
In (A) we show the overlaps between sets of different sources of physical miR-mRNA interactions. Only accounting for potential interactions that at least were predicted by two methods we assembled 48,939 interactions. In (B) we assumed that the expression fold change of mRNAs is a function of the miRs that specifically bind the underlying mRNAs. As such, we represented the presence/absence of binding miRs as a binary (1/0) matrix, where each of the units is 1 if the corresponding miR can physically interact with the mRNA and 0 otherwise. mRNAs are represented as a vector of their corresponding expression fold changes. Utilizing random forest regression we determined miRs that are significantly associated with the fold change of mRNAs. Specifically, each pair of mRNA and miR is represented by a local importance measure reflecting the drop/gain of regression accuracy of a mRNAs fold change if the underlying miR is excluded. (C) Determining their statistical significance by a Z-test, we iteratively permuted the vector of fold changes and the binding matrix of miRs and calculated local importance values after each permutation step. (D) Utilizing a set of human genes that are involved human signaling pathways, we determined 128 miRs that are significantly associated to the fold change of mRNAs, comparing 27 GBM samples to non-tumor control cases (P<0.05). In the table we show miRs that have been found to be significantly associated to N≥10 mRNAs. We observed that such miRs are predominantly over-expressed(⇑, expression fold change FC>1), while a minority of miRs are under-expressed (⇓, FC<−1) or unchanged (∼, −1≤FC≤1) in GBMs.
Figure 2
Figure 2. Characteristics of significantly associated miRs.
(A) A sigmoidal curve described the fold change of all mRNAs that appeared in signaling pathways and were not bound by significantly associated miRs. Focusing on mRNAs that appeared to be regulated by significantly associated miRs, the corresponding distribution significantly shifted toward higher and lower fold changes. (B) For each mRNA, we calculated the mean fold change of all miRs that were significantly associated with a given mRNA. Specifically, we found that the expression fold change significantly decreased with increasing expression of miRs (Pearson's r = −0.30, P<10−6). In the inset of (C), we utilized the binding positions of miRs on the 3′UTR of a given mRNA and calculated the cumulative frequency of significantly associated miRs. In comparison to other miRs we observed an overrepresentation of associated miRs that bind near the start of the 3′UTR. Focusing on associated miRs, we determined the enrichment of over-expressed miRs (fold change>1) in sets of miRs that bind within a certain distance from the start of the 3′UTR. We clearly observe that over-expressed miRs tend to increasingly bind nearby the 3′UTR start. Considering under-expressed miRs (FC<−1), we find that the enrichment distribution peaks around 500 bp form the start of the 3′UTR.
Figure 3
Figure 3. Significantly associated miRs in signaling pathways.
(A) Utilizing all significant associations between 128 miRs and 246 genes, we constructed a bipartite matrix between miRs and signaling pathways that are over(under)-expressed in human GBMs. We established a link if the sets of genes in a pathway overlapped with mRNAs that are associated with a certain miR. Specifically, we found 21 pathways that are largely over-expressed in GBMs and 87 miRs. While a majority of miRs ware over-expressed (expression fold change FC>1), we found a small minority of miRs that was under-expressed in GBMs (FC<−1). In particular, we highlighted a small cluster that pooled most of the under-expressed miRs and prominent pathways such as the p53 downstream and myc activation pathway (box). In (B) we mapped all interactions between associated miRs and genes that appeared in the corresponding pathways. Confirming our predictions, we found significant interactions between genes of the extracellular matrix and miR-29bc and -124a that have been previously implicated in glioblastomas and other cancer types (shaded area). Furthermore, miR-124a was previously reported as a regulator of CDK6 in GBMs.
Figure 4
Figure 4. Expression patterns of WEE1.
(A WEE1 is over-expressed in GBMs and Oligodendrogliomas. (B) Expression of WEE1 was validated by quantitative reverse transcription polymerase reaction (RT-qPCR) in five representative GBM tumor samples that belong to the GA subtype, five non-tumor samples, four tumor initiating/stem cell lines (TICs) and two unperturbed cell lines (human fibroblasts and HUVEC). We observed that TIC 308 showed an average WEE1 fold change that was similar to the corresponding averages in the GBM samples.
Figure 5
Figure 5. Significantly associated miRs of WEE1.
In (A) we show all significantly associated interactions between the mRNA of WEE1 and miRs where miR-128ab were under-expressed (fold change FC<−1) and miR-27a/93 were over-expressed (FC>1) in our GBM samples. (B). Corresponding miR binding sites in the WEE1 3′UTR are located in three main binding areas within the first 500bp from the 3′UTR start. Specifically, miR-128/27 have two binding sequences around nucleotides 15 and 236 while miR-302abcd/372/93 potentially recognize a common binding site around nucleotide 465. (C) Using RTqPCR TaqMan assays, we detected that miR-128/27b were under-expressed and miR-27b was strongly over-expressed in tumor samples. We found a similar miR expression profile in the tumor initiating/stem cell line, TIC308, where miR-128 and miR-27b kept their low expression levels. (D) Transfection of miR-specific expression vectors of TIC308 cells allowed the recovery of miR-128/27b levels as measured by RTqPCR.
Figure 6
Figure 6. Effects of significantly associated miRs on WEE1 expression.
(A) miRs-128/27a/27b that are under-expressed in glioma were transiently over-expressed in TIC308 cells with corresponding pEp-miR-expression vectors. Co-transfecting this cells with a luciferase reporter constructs that contained the whole UTR region of WEE1, we observed decreasing luciferase activity (brown/green bars). Furthermore, co-transfection with reporters containing mutated sequences of seed regions in the three potential binding sites around nucleotides 15, 236 and 465 of the WEE1 3′UTR (yellow bars) showed an increase in luciferase activity when binding sites 15 and 136 of miR-128/27 were mutated. However, we did not find an effect when position 465 was mutated where binding of the naturally over-expressed miRs-302/372/93 was predicted. Our results allowed us to conclude that miRs-128/27a/27b indeed bind the 3′UTR of WEE1, and their low expression in gliomas potentially plays a crucial role in the high levels of WEE1 expression in these tumors. (B) Similarly to silencing WEE1 with a corresponding siRNA, ectopic expression of miR-128 and miR-27b reduced WEE1 mRNA and protein levels in synchronized cells of TIC308. (C) Downstream effects of WEE1 modulation by miRs was observed as CDK1_Y15 phosphorylation is similar compared to when WEE1 was directly down-regulated by a specific siRNA treatment. In particular, we observed that the recovery of miR-128 as well as over-expression of miR-27b constrained WEE1 expression.

Similar articles

Cited by

References

    1. Lagos-Quintana M, Rauhut R, Yalcin A, Meyer J, Lendeckel W, et al. Identification of tissue-specific microRNAs from mouse. Curr Biol. 2002;12:735–739. - PubMed
    1. Houbaviy HB, Murray MF, Sharp PA. Embryonic stem cell-specific MicroRNAs. Dev Cell. 2003;5:351–358. - PubMed
    1. Lytle JR, Yario TA, Steitz JA. Target mRNAs are repressed as efficiently by microRNA-binding sites in the 5′ UTR as in the 3′ UTR. Proc Natl Acad Sci U S A. 2007;104:9667–9672. - PMC - PubMed
    1. Du T, Zamore PD. microPrimer: the biogenesis and function of microRNA. Development. 2005;132:4645–4652. - PubMed
    1. Lai EC. Micro RNAs are complementary to 3′ UTR sequence motifs that mediate negative post-transcriptional regulation. Nat Genet. 2002;30:363–364. - PubMed

Publication types

MeSH terms