. 2011 Apr;14(4):442-51.
doi: 10.1038/nn.2764. Epub 2011 Feb 27.

MHCI negatively regulates synapse density during the establishment of cortical connections

Affiliations

MHCI negatively regulates synapse density during the establishment of cortical connections

Marian W Glynn et al. Nat Neurosci. 2011 Apr.

Abstract

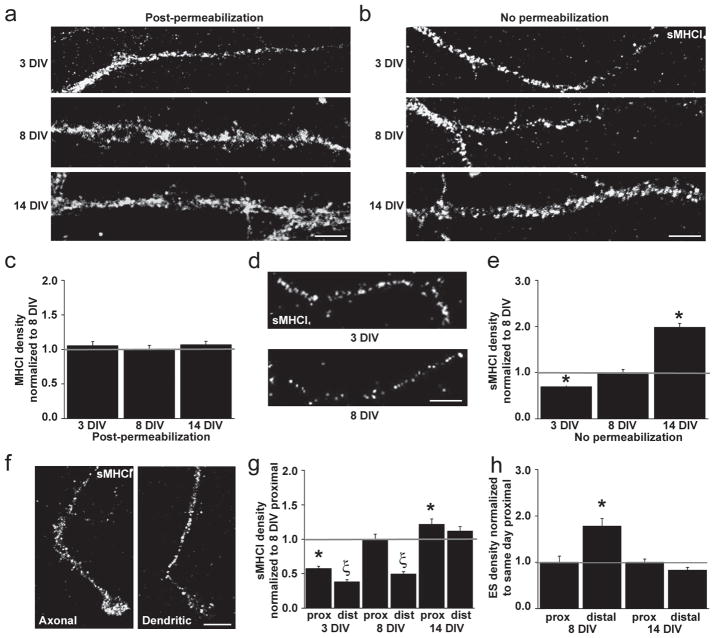
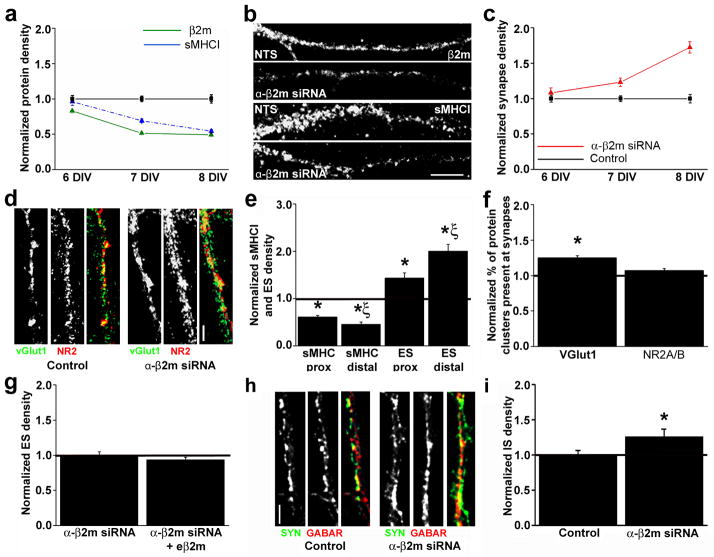
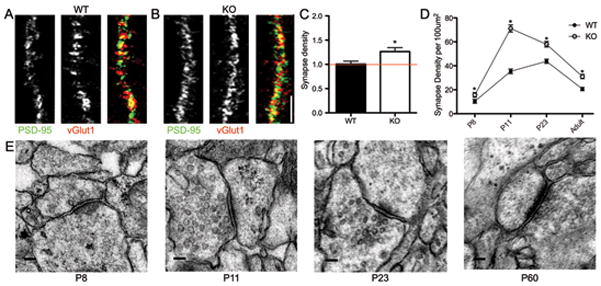
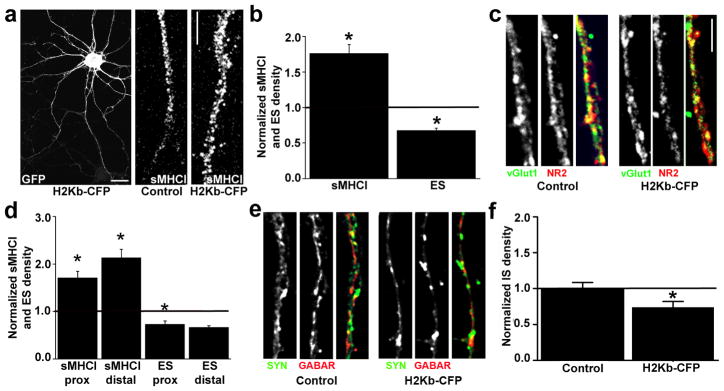
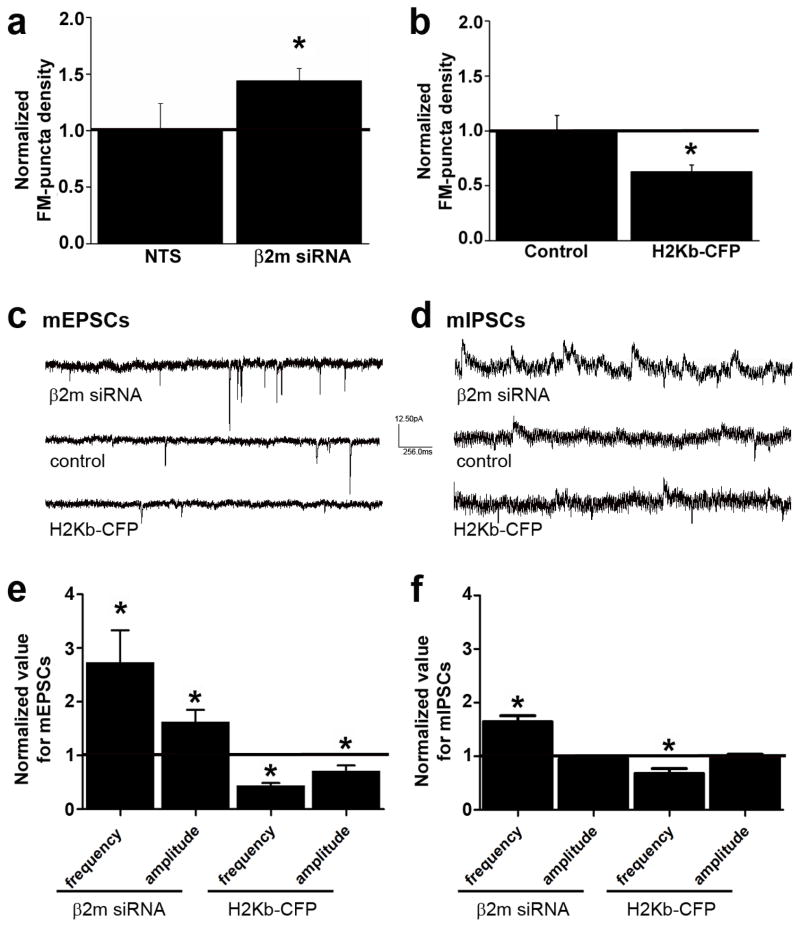
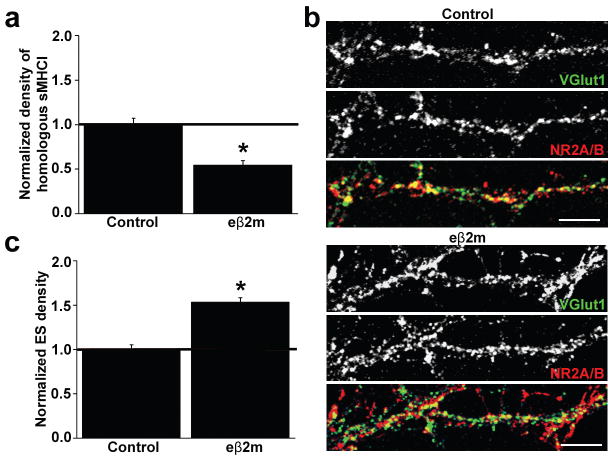
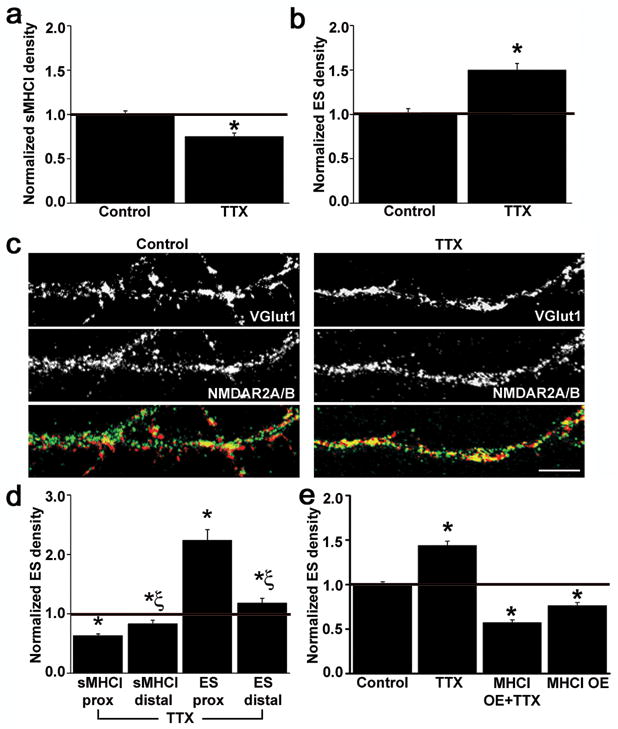
Major histocompatibility complex class I (MHCI) molecules modulate activity-dependent refinement and plasticity. We found that MHCI also negatively regulates the density and function of cortical synapses during their initial establishment both in vitro and in vivo. MHCI molecules are expressed on cortical neurons before and during synaptogenesis. In vitro, decreasing surface MHCI (sMHCI) on neurons increased glutamatergic and GABAergic synapse density, whereas overexpression decreased it. In vivo, synapse density was higher throughout development in β2m(-/-) mice. MHCI also negatively regulated the strength of excitatory, but not inhibitory, synapses and controlled the balance of excitation and inhibition onto cortical neurons. sMHCI levels were modulated by activity and were necessary for activity to negatively regulate glutamatergic synapse density. Finally, acute changes in sMHCI and activity altered synapse density exclusively during early postnatal development. These results identify a previously unknown function for immune proteins in the negative regulation of the initial establishment and function of cortical connections.


Figures

Fig. 1
Fig. 1. MHCI is present at the surface of cortical neurons before, during, and after synapse formation
(a–b) Images of dendrites from cortical neurons immunostained for MHCI proteins using the OX-18 antibody at 3, 8, and 14 d.i.v. (top to bottom) are shown proximal to distal from soma (left to right in each image). (a) MHCI is present in clusters throughout all dendrites at all ages examined. (b) Surface MHCI (sMHCI) is also present on dendrites of all cells at all ages examined (n=540 dendrites, 180 cells). (c) The density of MHCI detected after permeabilization does not vary over time (normalized to 8 d.i.v.: 3 d.i.v., 1.06 ± 0.05, p = 0.48; 8 d.i.v., 1.00 ± 0.05; 14 d.i.v., 1.07 ± 0.05, p = 0.45). (d) sMHCI clusters are present in isolated axons at 3 and 8 d.i.v. (e) sMHCI clusters on dendrites increase in density with age. (normalized to 8 d.i.v.: 3 d.i.v., 0.70 ± 0. 04, p < 0.001; 8 d.i.v., 1.00 ± 0.07; 14 d.i.v., 1.98 ± 0.09, p < 0.001). (f) At 3 d.i.v., sMHCI clusters are also present on axonal and dendritic growth cones (n = 57 growth cones, 20 neurons). (g) At 3 and 8 d.i.v., sMHCI density is higher in proximal dendrites and lower in distal portions of the same dendrites (normalized to 8 d.i.v. proximal: 3 d.i.v., proximal, 0.58 ± 0.03, distal, 0.38 ± 0.03, p < 0.001; 8 d.i.v. proximal, 1.00 ± 0.07, distal, 0.50 ± 0.03, p < 0.001; *, significant difference from 8 d.i.v. proximal density values; Ξ, significant difference between distal and same age proximal densities). At 14 d.i.v., this uneven distribution is not observed (sMHCI normalized to 8 d.i.v. proximal: 14 d.i.v proximal, 1.22±0.08; distal, 1.12±0.06, p=0.07). (h) Glutamatergic synapses (excitatory synapses; ES) are also unevenly distributed along dendrites. At 8 d.i.v., ES density is lower in proximal dendrites and higher in distal dendritic regions (normalized to proximal: proximal, 1.00 ± 0.13; distal, 1.78 ± 0.16, p <0.001; *, significant difference from same age proximal density values). At 14 d.i.v., synapses are evenly distributed across dendrites (synapse values normalized to 14 d.i.v. proximal: proximal, 1.00 ± 0.07; distal, 0.83 ± 0.06, p = 0.07). *, p<0.05; Scale bars = 5 μm.
Fig. 2
Fig. 2. Acute β2m knockdown decreases sMHCI and increases glutamatergic and GABAergic synapse density
(a) β2m siRNA knocks down endogenous β2m and sMHCI protein. Neurons were transfected with β2m siRNA at 5 d.i.v., resulting in a significant decrease in β2m cluster density (green, solid line) within 24h and reaching a maximum of 51% KD by 8 d.i.v. (6 d.i.v., 0.83 ± 0.03, p < 0.001; 7 d.i.v., 0.51 ± 0.02, p < 0.001; 8 d.i.v., 0.49 ± 0.02, p < 0.001). β2m KD decreases sMHCI density (blue, dashed line) within 48h, reaching a maximum KD of 46% also by 8 d.i.v. (6 d.i.v., 0.96 ± 0.05, p = 0.8; 7 d.i.v., 0.69 ± 0.02, p < 0.001; 8 d.i.v., 0.54 ± 0.02, p < 0.001). All values are normalized to age-matched non-targeting sequence (NTS) controls. (b) Images showing the distribution of β2m (top two images) and sMHCI (lower two images) at 8 d.i.v. Dendrites are oriented proximal to distal, left to right. (c–d) Decreasing sMHCI via β2m KD increases glutamatergic synapse (excitatory synapse; ES) density (red, solid line) within 48h of transfection, reaching a maximum 72% increase by 8 d.i.v. (6 d.i.v., 1.08 ± 0.07, p = 0.34; 7 d.i.v., 1.23 ± 0.06, p < 0.01; 8 d.i.v., 1.72 ± 0.08, p < 0.001). (d) Images of dendrites immunostained for vGlut1 (left) and NR2A/B (middle) from neurons transfected with NTS control (left panels) or β2m siRNA (right panels). Yellow in the overlay image indicates synapses. Dendrites are oriented proximal to distal, top to bottom. (e) The inversely related proximal-distal distributions of sMHCI and glutamatergic synapses are preserved after β 2m KD (sMHCI density: proximal, 0.60 ± 0.03, p < 0.001; distal, 0.48 ± 0.05, p < 0.001; ES density: proximal, 1.43 ± 0.1, p < 0.01; distal, 2.00 ± 0.14, p < 0.001). (f) β2m KD increases the percentage of vGlut1 clusters at synapses by almost 30% (26±0.03%, p<0.001), with no effect on NR2A/B enrichment at synapses (1.07 ± 0.03, p = 0.14). (g) Addition of exogenous β2m (eβ2m) does not change the effect of decreasing sMHCI on ES (normalized to β2m siRNA: 0.93 ± 0.04, p = 0.29). (h) Images of dendrites immunostained for synapsin (syn; left) and GABA receptor subunits (GABAR; middle) from neurons transfected with NTS control (left panels) or β2m siRNA (right panels). Yellow in the overlay image indicates synapses. (i) Decreasing sMHCI via β2m KD increases GABAergic synapse (inhibitory synapse; IS) density by almost 30% (1.27 ± 0.10, p < 0.05, n=20 dendrites). Scale bars = 5 μm.
Fig. 3
Fig. 3. Synapse density is increased between visual cortical neurons from β2m−/− mice both in vitro and in vivo throughout development
Images of neurons from 8 d.i.v. WT (a) and β2m−/− (b) mouse cultures immunostained for vGlut1 (green) and PSD-95 (red). Yellow indicates glutamatergic synapses. Scale bar = 5μm. (c) Glutamatergic synapse density is increased by 26% in cultured β2m−/− neurons (normalized to WT, 1.26±0.08, p<0.01). (d) Total synapse density in β2m−/− mice is greater at all ages examined compared to WT controls (P8: WT, 10.35 ± 0.74, β2m−/−, 15.76 ± 1.13; n = 40 sections each, p < 0.001; P11: WT, 35.42 ± 1.85, β2m−/−, 71.18 ±2. 96, n =48 and 54 sections, respectively, p < 0.001; P23: WT, 43.80 ± 1.70, β2m−/−, 58.05 ± 2.27, n = 39 sections each, p < 0.001; P60: WT, 20.65 ± 1.16, β2m−/−, 31.12 ± 1.23, n = 39 sections each, p < 0.001. (e) Transmission electron micrographs of synapses from P8, P11, P23, and P60 (adult) sections. Sections were blinded and analyzed independently by two different researchers. Only those synapses that were confirmed by both were included in the quantification. Total synapse density was calculated as the number of synapses per 100μm2 of neuropil. * = p<0.05. Scale bars = 0.5 μm.
Fig. 4
Fig. 4. MHCI overexpression decreases glutamatergic synapse density
(a) Neurons were transfected with H2-Kb-CFP at 6 d.i.v. Within 48h of transfection, MHCI was overexpressed in both proximal and distal dendrites. sMHCI density in dendrites (high magnification images in middle and right panels) of H2-Kb-CFP expressing cells (right) was qualitatively greater than in control cells (middle). Dendrites are oriented proximal to distal, top to bottom. Scale bars = 20 μm, left panel; 5 μm right panels. (b) H2-Kb-CFP OE increases sMHCI density by 76 ± 0.12% (p < 0.001) and decreases glutamatergic synapse (ES) density by 33 ± 0.03% (p < 0.001). (c) Neurons transfected with H2-Kb-CFP (right panels) or their non-transfected neighbors (left panels) were immunostained for vGlut1 (left) and NR2A/B (NR2; middle). Synapses are yellow in the overlay images (right). (d) MHCI OE ablates the proximal-distal distribution of both sMHCI (normalized to same region control: proximal: 1.70 ± 0.14, p < 0.001; distal: 2.13 ± 0.18, p < 0.001, n = 17 dendrites, 8 neurons each) and excitatory synapses (ES; normalized to same region control: proximal: 0.73 ± 0.08, p < 0.05; distal: 0.66 ± 0.03, p < 0.001, n = 19 dendrites, 8 neurons each). (e) Neurons transfected with H2-Kb-CFP (right panels) or their non-transfected neighbors (left panels) were immunostained for synapsin (syn: left) and GABAR subunits (GABAR; middle). Synapses are yellow in the overlay images (right). (f) H2-Kb-CFP OE decreases GABAergic synapse density (IS) by a little over 25% (0.74 ± 0.08, n = 20 dendrites, 10 neurons each, p < 0.05). Scale bars = 5μm. * = p<0.05.
Fig. 5
Fig. 5. MHCI bidirectionally regulates glutamatergic and GABAergic synaptic transmission
(a) β2m KD increases the density of FM1-43 labeled puncta by 55±0.12% (values normalized to NTS; p < 0.01, n = 15 dendrites, 5 cells each) (b) whereas MHCI OE decreases the density of FM4-64 staining by 35% (values normalized to GFP-transfected controls; 0.63 ± 0.06, p < 0.05, n = 6 dendrites, 3 neurons each). (c) Representative traces from whole-cell patch-clamp recordings of mEPSCs from 8–10 d.i.v. control cultured cortical neurons or neurons transfected with either β2m siRNA or H2-Kb-CFP. Qualitatively, β2m KD dramatically increases, and H2-Kb OE strongly decreases, glutamatergic synaptic transmission. (d) Representative traces from whole-cell patch-clamp recordings of mIPSCs from 8–10 d.i.v. control cultured cortical neurons or neurons transfected with either β2m siRNA or H2-Kb-CFP. Qualitatively, β2m KD increases, and H2-Kb OE decreases, GABAergic synaptic transmission. (e) β2m KD significantly increases both mEPSC frequency (2.74 ± 0.60, p < 0.001, n = 8) and amplitude (1.63 ± 0.22, p < 0.05, n = 8), while H2-Kb-CFP OE decreases both measures (freq: 0.45 ± 0.04, p < 0.001, n = 8; amp: 0.72 ± 0.10, p < 0.05, n = 8). (f) In contrast, β2m KD significantly increases mIPSC frequency (1.77 ± 0.12, p < 0.05, n = 12), while H2-Kb-CFP OE decreases it (0.68 ± 0.10, p < 0.05, n = 12), but neither manipulation changes mIPSC amplitude (KD: 0.96 ± 0.03, p = 0.78; OE: 1.01 ± 0.03, p = 0.36).
Fig. 6
Fig. 6. Homologous MHCI clusters negatively regulate glutamatergic synapse density
(a) Exposure of neurons to eβ2m for 36h decreases the homologous (MHCI alone) to heterologous (MHCI plus β2m) ratio of sMHCI clusters by 45% at 8 d.i.v. (p < 0.001). (b) ICC staining for vGlut1 (top) and NR2A/B (middle) qualitatively shows the increase in ES density (yellow in overlay, bottom) caused by decreasing homologous sMHCI. (c) Decreasing the homologous to heterologous ratio of sMHCI clusters increases ES density by 53 ± 0.05% (p < 0.001). All values are normalized to the culture-matched controls. Scale bar = 5 μm.
Fig. 7
Fig. 7. Changes in MHCI levels are necessary for activity-dependent changes in synapse density
(a) Exposure to TTX (1μM, 24h) decreases sMHCI density at 8 d.i.v. by 25 ± 0.04% (p < 0.001). (b) TTX treatment increases glutamatergic synapse (ES) density, as defined by co-localized vGlut1 and NR2A/B, by 44 ± 0.07% (p<0.001). (c) Images of neurons treated with vehicle (left panels) or TTX (right panels) and immunostained for VGlut1 (top) and NR2A/B (middle). Synapses are visible as yellow puncta in the overlay (bottom). Dendrites are oriented proximal to distal, left to right. (d) TTX inverts the proximal-distal distribution of sMHCI (normalized to same region control: proximal: 0.63 ± 0.03, p < 0.001; distal: 0.83 ± 0.06, p < 0.05) and glutamatergic synapses (ES; proximal: 1.89 ± 0.15, p < 0.001; distal: 1.22 ± 0.06, p < 0.05), but maintains the inverse relationship between local levels of sMHCI and ES (*, significant difference from control; Ξ, significant difference of distal density from same age proximal density values). (e) The TTX-induced increase in ES density is completely prevented by MHCI OE (TTX: 1.44 ± 0.05, n = 25 dendrites, p < 0.001; MHC OE: 0.77 ± 0.03, n =71, p < 0.001; MHC OE + TTX: 0.57 ± 0.03, n = 48, p < 0.001). Scale bar = 5 μm.

Similar articles

Cited by

References

    1. Waites CL, Craig AM, Garner CC. Mechanisms of vertebrate synaptogenesis. Annual review of neuroscience. 2005;28:251–274. - PubMed
    1. McAllister AK. Dynamic aspects of CNS synapse formation. Annual review of neuroscience. 2007;30:425–450. - PMC - PubMed
    1. Flavell SW, et al. Activity-dependent regulation of MEF2 transcription factors suppresses excitatory synapse number. Science. 2006;311:1008–1012. - PubMed
    1. Margolis SS, et al. EphB-mediated degradation of the RhoA GEF Ephexin5 relieves a developmental brake on excitatory synapse formation. Cell. 2010;143:442–455. - PMC - PubMed
    1. O’Connor TP, et al. Semaphorin 5B mediates synapse elimination in hippocampal neurons. Neural Dev. 2009;4:18. - PMC - PubMed

Publication types

MeSH terms

Substances

LinkOut - more resources