. 2011 Mar 18;41(6):733-46.
doi: 10.1016/j.molcel.2011.02.008. Epub 2011 Feb 25.

Functional identification of optimized RNAi triggers using a massively parallel sensor assay

Affiliations

Functional identification of optimized RNAi triggers using a massively parallel sensor assay

Christof Fellmann et al. Mol Cell. .

Abstract

Short hairpin RNAs (shRNAs) provide powerful experimental tools by enabling stable and regulated gene silencing through programming of endogenous microRNA pathways. Since requirements for efficient shRNA biogenesis and target suppression are largely unknown, many predicted shRNAs fail to efficiently suppress their target. To overcome this barrier, we developed a "Sensor assay" that enables the biological identification of effective shRNAs at large scale. By constructing and evaluating 20,000 RNAi reporters covering every possible target site in nine mammalian transcripts, we show that our assay reliably identifies potent shRNAs that are surprisingly rare and predominantly missed by existing algorithms. Our unbiased analyses reveal that potent shRNAs share various predicted and previously unknown features associated with specific microRNA processing steps, and suggest a model for competitive strand selection. Together, our study establishes a powerful tool for large-scale identification of highly potent shRNAs and provides insights into sequence requirements of effective RNAi.


Figures

Figure 1
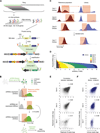
Figure 1. Sensor assay for assessment of shRNA potency
(A) Schematic of the Sensor assay. The pSENSOR vector harbors a Tet-inducible shRNA and its cognate target sequence in the 3'UTR of a PGK-driven Venus reporter. Upon infection of cells expressing rtTA, Dox treatment induces shRNA expression. In turn, the extent of Venus knockdown directly reports shRNA potency. Flow cytometry plots depict predicted fluorescence intensity distributions for shRNAs of different potencies. (B) Immunoblotting of Cebpa and Pten in NIH3T3s transduced with Cebpa or Pten shRNAs of different potencies. C, sh.Luci.1309 control shRNA. KD%, knockdown level relative to C and normalized to Actin. (C) Flow cytometry analysis of ERC reporter cells transduced with pSENSOR carrying indicated shRNA-Sensor cassettes and treated with or without Dox (On-/OffDox). The leftmost peaks represent uninfected cells. C, control construct harboring an shRNA with a non-corresponding Sensor. (D) Quantification of Venus fluorescence intensity of OnDox cells shown in C and uninfected reporter cells (uninf) used to define background levels. Error bars represent the standard deviation of triplicates. (E) Flow cytometry plots of rtTA reporter cells transduced with a MiniPool of 17 shRNA-Sensor constructs and treated +/− Dox for 7 days. The lower panels illustrate Venus-based cell sorting of each population into three equal subpopulations. (F) Quantification of shRNA sequence reads within the sorted populations outlined in E. For each shRNA, the distribution of reads among low/medium/high Venus fractions is plotted as a percentage of total reads of that shRNA. The shRNAs are clustered according to their pre-annotated groups (see Figure S1E for details).
Figure 2
Figure 2. Sensor Ping-Pong strategy for deconvolution of complex shRNA-Sensor libraries
(A) Schematic of design and cloning of shRNA-Sensor libraries. A library of 20,000 constructs tiling every possible target site in nine mammalian transcripts was designed. 185-mer oligonucleotides containing shRNAs and cognate Sensors were synthesized and cloned into a 5’miR30 recipient vector. In a second step, the 3'miR30-PGK-Venus reporter cassette was cloned between shRNAs and their cognate Sensor to reconstitute complete pSENSOR vectors. (B) Schematic of the Sensor Ping-Pong sorting strategy. Reporter cells infected with an shRNA-Sensor library at single copy are cultured sequentially in presence or absence of Dox. According to reference populations, sorting gates are drawn to include only cells harboring potent shRNAs (see Figure S2G and S2H for details). Through iterative rounds of shRNA induction and FACS-based selection, the initial library is reduced to a pool of functional shRNA-Sensor constructs that can be identified by deep sequencing. (C) Representative flow cytometry histograms of Top5 reference and library populations at sorting step 1, 2, 3 and 7. ERC reporter cells were infected with the Library, Top5 or Bottom5 pools, grown repeatedly for 6–7 days On- then OffDox, and sorted according to the indicated gates. Data is presented as Venus intensity histograms; actual sorts were done using Venus/FSC dot plots (see Figure S2H for details). (D) Histogram of library complexity over sort cycles. Shown are normalized read numbers in one replicate for each shRNA represented within the pool after the indicated sorts. (E) Correlation of reads per shRNA between two replicates after the indicated sorts. r, Pearson correlation coefficient. (F) Correlation of reads per shRNA between the initial library pool and the pools after the indicated sorts. r, Pearson correlation coefficient.
Figure 3
Figure 3. Assay performance of control shRNAs and shRNA-Sensor constructs tiling Trp53
(A) Enrichment or depletion of 17 control shRNA-Sensor constructs in transduced reporter cells before sorting (top), after Sort 3 (middle) and Sort 7 (bottom). Values denote the log2 ratio of reads at the indicated stage compared to reads in the initial shRNA-Sensor plasmid library. (B) Representation of control shRNA-Sensor constructs in the initial plasmid library and after seven sorts. Pie wedges represent mean values of technical (Library) or biological (Sort 7) duplicates. (C) Trp53 transcript coverage in the initial library. Shown are absolute reads (mean of technical duplicates) for 1733 Trp53 shRNA-Sensor constructs in the plasmid pool. *, XhoI restriction site affecting the cloning of 45 shRNAs. **, most abundant shRNA, sh.p53.816. (D) Read numbers (mean of biological duplicates) for Trp53 shRNA-Sensor constructs after 4 Ping-Pong cycles (Sort 7). 814, most abundant shRNA, sh.p53.814. (E) Product enrichment scores (ProdEn, representing the product of the relative enrichment in each replicate at Sort 7 compared to the initial library) of all 1733 Trp53 shRNA-Sensor constructs. Numbers (279, 393, 703, 814) pinpoint highly enriched shRNAs. (F) Integrated Score for selected shRNAs analyzed by western blotting. (G) Western blot analysis of Trp53 levels in adriamycin-treated NIH3T3s stably expressing the shRNAs indicated above from a single genomic integration. C1 and C2, control shRNAs (sh.Bcl2.906, sh.Bcl2.1132). C1 25% and C2 25%, 1:4 diluted control samples. KD%, knockdown level relative to C1 and normalized to Actin.
Figure 4
Figure 4. Analysis of Sensor-identified shRNAs targeting Bcl2 and Mcl1
(A) Product enrichment scores (ProdEn) of 1937 shRNA-Sensor constructs tiling the common region of both murine Bcl2 transcripts. *, sh.Bcl2.1241. Numbers highlight enriched shRNAs that were analyzed by immunoblotting. (B) Integrated Score for selected Bcl2 shRNAs. (C) Western blot analysis of Bcl2 levels in NIH3T3s expressing the shRNAs indicated above from a single genomic integration. Bcl2−/− MEFs served as control. C, sh.Luci.1309. Two different exposures are shown. KD%, knockdown level relative to C and normalized to Actin. (D) Integrated Score for selected Bcl2 shRNAs and western blot analysis of Bcl2 levels in NIH3T3s expressing the indicated shRNAs from a single (single copy) or multiple (high copy, red) genomic integrations. C, uninfected cells. (E) Product enrichment scores (ProdEn) of 3449 shRNA-Sensor constructs covering the mouse Mcl1 transcript. *, sh.Mcl1.1792. **, sh.Mcl1.2018. Numbers highlight enriched shRNAs that were analyzed by immunoblotting. (F) Integrated Score for selected Mcl1 shRNAs. (G) Western blot analysis of Mcl1 expression in NIH3T3s expressing the shRNAs indicated above from a single genomic integration. C, sh.Luci.1309. Two different exposures are shown. (H) Synthetic lethal assay using the BH3-mimetic ABT-737 in combination with a potent Sensor-identified Mcl1 shRNA (sh.Mcl1.1334) or a control shRNA (C, sh.Luci.1309). NIH3T3s expressing the indicated shRNA from a single or multiple genomic integrations were treated with ABT-737 for 48 h and subsequently analyzed for viable cell numbers using flow cytometry (FSC/SSC and propidium iodide staining). DMSO (1%) treated cells were used for normalization. Error bars represent the standard deviation of duplicate experiments.
Figure 5
Figure 5. Analysis of Sensor-identified shRNAs targeting mouse and human MYC
(A) Product enrichment scores (ProdEn) of 2350 shRNA-Sensor constructs tiling the mouse Myc transcript. (B) Integrated Score for selected scoring Myc shRNAs. (C) Western blot analysis of immortalized Rosa26-rtTA-M2 (RRT) MEFs expressing Flag-tagged murine Myc and shRNAs indicated above at single copy. Overexpression of Myc lacking the 3’UTR rescues knockdown by sh.Myc.1988 and 2105 (Figure S4B). C, sh.Luci.1309. KD%, knockdown level relative to C and normalized to Actin. (D) Competitive proliferation assay of Eμ-Myc; p53−/− lymphoma cells expressing the indicated shRNAs. The relative percentage of shRNA expressing cells at indicated days following retroviral transduction is shown. C, sh.Luci.1309. (E) Product enrichment scores (ProdEn) of 2328 shRNA-Sensor constructs tiling the human MYC transcript. (F) Integrated Score for selected scoring MYC shRNAs. (G) Flag-tag western blot analysis in RRT MEFs expressing Flag-tagged human MYC and shRNAs indicated above at single copy. C, sh.Luci.1309. (H) Competitive proliferation assay of K-562 and MOLM-13 human leukemia cell lines expressing the indicated shRNAs. The relative percentage of shRNA expressing cells at the indicated days following shRNA induction is shown. C, sh.Luci.1309.
Figure 6
Figure 6. Sequence features of Sensor-identified shRNAs and step-specific RNAi requirements
(A) Overall A/U content of non-scoring (Score <1) and scoring (Score >10) shRNAs, showing enrichment of relatively A/U-rich shRNAs. (B) Local G/C content (4 nt sliding window) of non-scoring (Score <1) and scoring (Score >10) shRNAs, indicating thermodynamic asymmetry of scoring shRNAs. (C) Nucleotide frequency in non-scoring (Score <1, top) and scoring (Score >10, bottom) shRNA-Sensor constructs. Shown are 22 nt shRNA guide strands (dark colors, reverse complement to 22 nt target site in endogenous transcript) and adjacent mRNA regions flanking the target site (pastel colors, reverse complement to mRNA). *, p <0.01 (Pearson’s χ2 test with Šidák correction). (D) Nucleotide bias of shRNAs that were significantly enriched (>5 fold) at the respective step and sufficiently represented (>100 reads) at the previous state. Drosha indicates sequences enriched from pri- to pre-miRNA (733 shRNAs). Dicer indicates sequences enriched from pre- to mature miRNA (931 shRNAs). RISC indicates sequences enriched from mature miRNA to shRNA representation at the genomic level after Sort 7 (root mean square value of all 4 replicates; 216 shRNAs). Data is shown for ERC cells; comparable patterns were observed in HEK293T cells.
Figure 7
Figure 7. Potent shRNAs show a strong strand bias dictated by guide position 1 and 20
(A) Graphical analysis of the nucleotide bias at position 1 of the guide strand, demonstrating specific binding preferences for each nucleotide. The graph shows the correlation between dissociation constants obtained from data on crystal structures of the MID domain of human AGO2 (Frank et al., 2010) and Sensor-derived nucleotide frequencies. A linear regression indicates the trend of the dataset. r, Pearson correlation coefficient. (B) Model for AGO2-mediated competitive guide selection. Specific binding of the 5’ nucleotide to the MID domain of vertebrate AGO2 strongly influences strand selection, thereby defining the RISC-loaded guide strand (see Figure S6C for details). (C) Nucleotide frequency bias of favored (guide/passenger >50; 1546 shRNAs) and neglected (guide/passenger <0.02; 439 shRNAs) guide strands in ERC cells transduced with the Sensor library. Comparable results were obtained with HEK293T cells. (D) Mean guide versus passenger ratios for scoring (Score >10) and non-scoring (Score <1) shRNAs in ERC and HEK293T cells transduced with the Sensor library. Error bars represent the standard error of the mean.

Similar articles

Cited by

References

    1. Ameres SL, Martinez J, Schroeder R. Molecular basis for target RNA recognition and cleavage by human RISC. Cell. 2007;130:101–112. - PubMed
    1. Bartel DP. MicroRNAs: Genomics, Biogenesis, Mechanism, and Function. Cell. 2004;116:281–297. - PubMed
    1. Bassik MC, Lebbink RJ, Churchman LS, Ingolia NT, Patena W, LeProust EM, Schuldiner M, Weissman JS, McManus MT. Rapid creation and quantitative monitoring of high coverage shRNA libraries. Nat Methods. 2009;6:443–445. - PMC - PubMed
    1. Brummelkamp TR, Bernards R, Agami R. A system for stable expression of short interfering RNAs in mammalian cells. Science. 2002;296:550–553. - PubMed
    1. Buhler M, Spies N, Bartel DP, Moazed D. TRAMP-mediated RNA surveillance prevents spurious entry of RNAs into the Schizosaccharomyces pombe siRNA pathway. Nat Struct Mol Biol. 2008;15:1015–1023. - PMC - PubMed

Publication types