. 2011 Mar 14;208(3):505-18.
doi: 10.1084/jem.20101824. Epub 2011 Feb 21.

Cutaneous immunosurveillance by self-renewing dermal gammadelta T cells

Affiliations

Cutaneous immunosurveillance by self-renewing dermal gammadelta T cells

Nital Sumaria et al. J Exp Med. .

Abstract

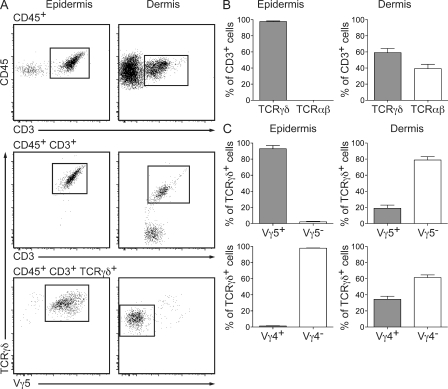
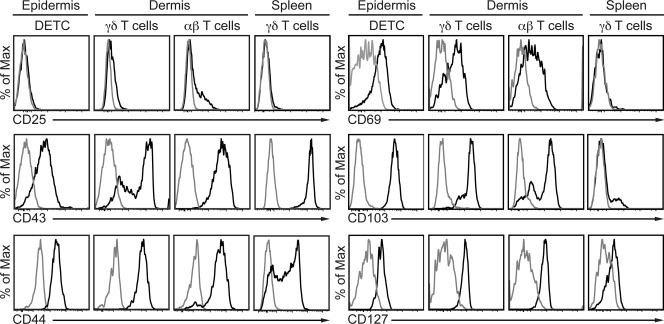
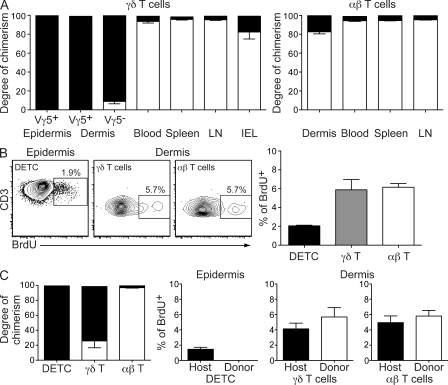
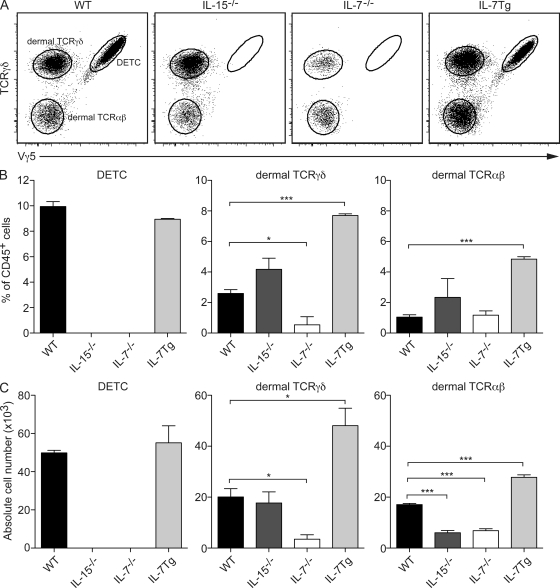
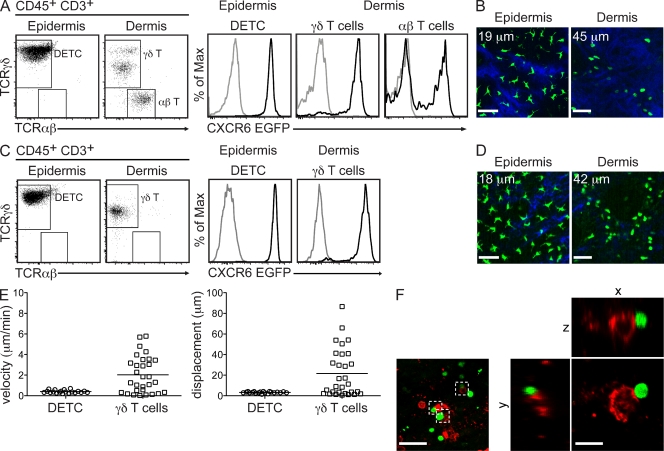
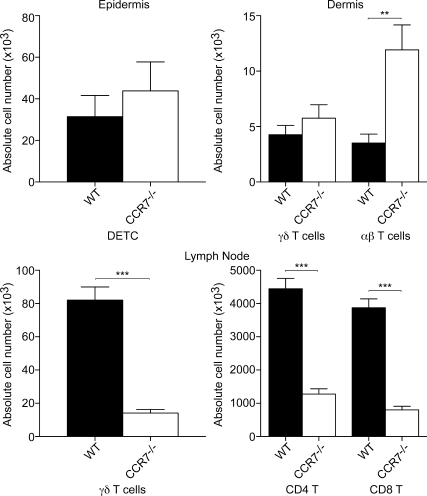
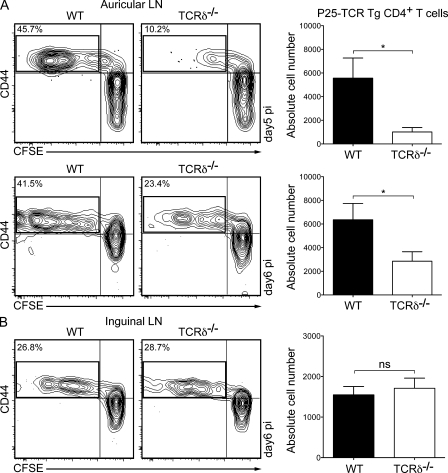
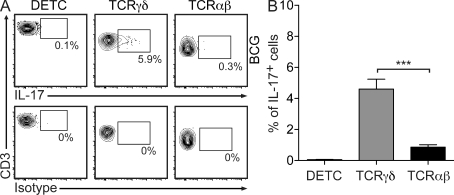
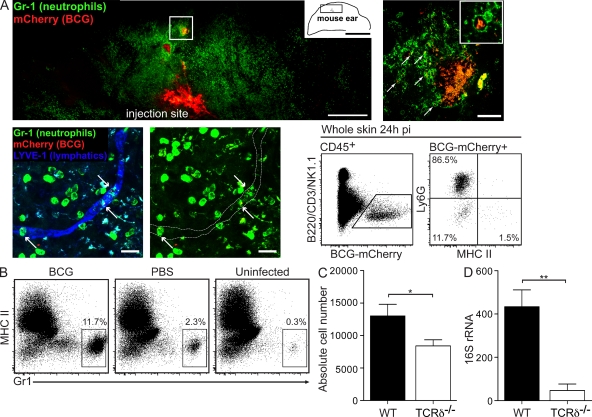
The presence of γδ T cell receptor (TCR)-expressing cells in the epidermis of mice, termed dendritic epidermal T cells (DETCs), is well established. Because of their strict epidermal localization, it is likely that DETCs primarily respond to epithelial stress, such as infections or the presence of transformed cells, whereas they may not participate directly in dermal immune responses. In this study, we describe a prominent population of resident dermal γδ T cells, which differ from DETCs in TCR usage, phenotype, and migratory behavior. Dermal γδ T cells are radioresistant, cycle in situ, and are partially depend on interleukin (IL)-7, but not IL-15, for their development and survival. During mycobacterial infection, dermal γδ T cells are the predominant dermal cells that produce IL-17. Absence of dermal γδ T cells is associated with decreased expansion in skin draining lymph nodes of CD4(+) T cells specific for an immunodominant Mycobacterium tuberculosis epitope. Decreased CD4(+) T cell expansion is related to a reduction in neutrophil recruitment to the skin and decreased BCG shuttling to draining lymph nodes. Thus, dermal γδ T cells are an important part of the resident cutaneous immunosurveillance program. Our data demonstrate functional specialization of T cells in distinct microcompartments of the skin.


Figures

Figure 1.
Figure 1.
The mouse dermis harbors a population of γδ T cells. (A) Flow cytometry profiles of epidermal and dermal γδ T cells from ear skin of WT mice (n ≥ 9/group). Cells were gated on CD45+ (top), CD45+CD3+ (middle), or CD45+CD3+TCRγδ+ (bottom). (B) Percentage of αβ T cells and γδ T cells within dermal and epidermal CD3+ cells of ear skin in WT mice (n = 9). (C) TCRγδ usage of epidermal and dermal γδ T cells from WT mice (n = 9). Results are expressed as a frequency of TCRγδ+ T cells. Data are representative of at least two independent experiments. Data are presented as mean ± SEM.
Figure 2.
Figure 2.
Phenotypic analyses of dermal γδ T cells. Histograms of surface markers expressed by cutaneous and splenic γδ T cells from WT mice (n ≥ 3 per group). Histograms were pregated on CD45+MHC-IICD3+ cells before gating on γδ+ and γδ T cell populations. Expression of the indicated makers is also shown for DETCs, dermal αβ T cells, and splenic γδ T cells. Gray lines, isotype control staining; black lines, indicated antibodies. Data are representative of at least two independent experiments.
Figure 3.
Figure 3.
Dermal γδ T cells are predominantly radioresistant and proliferate locally in the skin. (A) Degree of chimerism of γδ T cells (left) and αβ T cells (right) in various organs obtained 12 wk after reconstituting lethally irradiated WT mice with CD45.1 congenic bone marrow. Filled bars, host CD45.2; open bars, donor CD45.1. (B, left) Flow cytometry profiles of BrdU incorporation by epidermal and dermal T cells isolated from WT mice (n ≥ 5/group) 6 d after initial BrdU administration. (right) Frequency of cutaneous BrdU+ T cells 6 d after initial BrdU administration in WT mice (n = 5). (C, left) Degree of chimerism of cutaneous T cells obtained 19 mo after reconstitution (n = 8; chimeras generated as described in A). Right, percentage of host- or donor-derived epidermal and dermal T cells that are BrdU+ in chimeric mice 6 d after initial BrdU administration (n = 8). Data are representative of two to four independent experiments.
Figure 4.
Figure 4.
Epidermal and dermal γδ T cells exhibit differential cytokine requirements for development/maintenance. (A) Flow cytometry profiles of cutaneous T cells isolated from WT, IL-15−/−, IL-7−/−, and IL-7Tg mice (n ≥ 3/group). Cells were gated on CD45+ CD3+. (B) Percentage of DETCs, dermal γδ T cells, and αβ T cells in the CD45+ leukocyte population in the ear skin of the various groups of mice. (C) Absolute numbers of DETCs, dermal γδ T cells, and αβ T cells in the ear skin of the various groups of mice. Data are representative of two to three independent experiments with at least three mice per group.
Figure 5.
Figure 5.
Real-time imaging of EGFP+ γδ T cells in ear skin of TCRβ−/−xCXCR6EGFP mice. (A) Flow cytometry profiles of epidermal and dermal γδ and αβ T cells isolated from ear skin of CXCR6EGFP mice (n ≥ 4 mice/group). Histograms display the level of EGFP expression (black histogram, CXCR6EGFP mice; gray histogram, WT mice). (B) Single-plane images from MP-IVM showing EGFP+ T cells in ear skin of CXCR6EGFP mouse at two different vertical depths (indicated by the number in the top left corner) along the z-projection. Bars, 31 µm. (C) Flow cytometry profiles of epidermal and dermal γδ T cells isolated from ear skin of TCRβ−/−xCXCR6EGFP mice (n ≥ 4 mice/group). Histograms display the level of EGFP expression by epidermal and dermal γδ T cells (black histogram, TCRβ−/−xCXCR6EGFP mice; gray histogram, WT mice). (D) Single-plane images from MP-IVM showing EGFP+ DETCs and dermal γδ T cells in ear skin of TCRβ−/−xCXCR6EGFP mouse at two different vertical depths (indicated by the number in the top left corner) along the z-projection. Bars, 31 µm. (E) Mean migratory velocity (left) and displacement (right) of DETCs and dermal γδ T cells from 20-min tracks (n > 20 cells; symbols represent individual cells) in TCRβ−/−xCXCR6EGFP mice. (F) Single-plane and three-dimensional images from dermal whole-mount stains depicting dermal EGFP+ γδ T cells in contact with MHC II+ cells in ear skin of TCRβ−/−xCXCR6EGFP mice. Bars: (left) 38 µm; (right) 13 µm. Data are representative of two to three independent experiments.
Figure 6.
Figure 6.
Effect of CCR7 deficiency on T cell numbers in the skin and LN. Absolute numbers of γδ T cells and αβ T cells in the ear skin and peripheral LN of WT and CCR7−/− mice (n ≥ 8 per group) under steady-state conditions. Data are representative of three independent experiments. Data are presented as mean ± SEM.
Figure 7.
Figure 7.
Antigen-specific CD4+ T cell response to BCG infection is decreased in TCRδ−/− mice. (A, left) Flow cytometry profiles of CFSE-labeled P25 transgenic CD4+ T cells recovered from auricular LN of WT and TCRδ−/− mice, 5 or 6 d after i.d. infection with 105 CFU BCG (n = 4–9/group). Data are representative of 1 (day 5 after infection) to 3 (day 6 after infection) independent experiments. (right) Absolute numbers of CD44+CFSElo/− P25 CD4+ T cells (indicated by the box in the top left quadrant; left) recovered from auricular LN. (B, left) Flow cytometry profiles of CFSE-labeled P25 transgenic CD4+ T cells recovered from inguinal LN of WT and TCRδ−/− mice, 6 d after i.p. infection with 105 CFU BCG (n = 7/group). Data are representative of two independent experiments. (right) Absolute number of CD44+CFSElo/− P25 transgenic CD4+ T cells (indicated by the box, left) recovered from inguinal LN. Data are presented as mean ± SEM.
Figure 8.
Figure 8.
Dermal γδ T cells are the predominant source of IL-17 in the skin after BCG infection. (A) Flow cytometry profiles of IL-17–producing cutaneous T cells isolated from ear skin of WT mice (n ≥ 4/group) 24 h after i.d. infection with 105 CFU BCG. Data are representative of five independent experiments. (B) Frequency of IL-17–producing cutaneous T cells isolated from ear skin of BCG-infected mice (n = 11).
Figure 9.
Figure 9.
Neutrophil recruitment to the site of BCG infection is compromised in the absence of IL-17-producing γδ T cells. (A, top left) Single-plane image from a dermal whole-mount stain depicting Gr1+ neutrophils at the site of BCG infection in ear skin of WT mice 24 h after infection. Bar, 500 µm. (top right) higher magnification of the boxed area in the top left panel depicting Gr1+ neutrophils around a deposit of BCG. Arrows point to BCG-containing Gr1+ neutrophils. Boxed inset shows a single Gr1+ neutrophil containing intracellular BCG bacilli. Bar, 50 µm. (bottom left) Extended focus image from a dermal whole-mount stain 36 h after BCG infection depicting BCG-incorporated Gr1+ neutrophils (arrows) in the lumen of a lymphatic vessel stained with anti–LYVE-1. Bars, 25 µm. (bottom right) Flow cytometry profiles of CD45+ leukocytes isolated from WT ear skin, 24h after i.d. infection with BCG-mCherry. CD45+ BCG-mCherry+ cells were further evaluated for Ly6G and MHC II expression. Data are representative of two to four independent experiments. (B) Flow cytometry profiles of Gr1+ cells infiltrating the skin of WT mice (n = 4), 24h after i.d. injection with BCG or PBS. Cells were gated on CD45+ CD3. Data are representative of 3 independent experiments. (C) Absolute cell number of Gr1+ neutrophils isolated from ear skin of WT and TCRδ−/− mice (n = 14–17 per group), 24 h after i.d. infection with BCG. Data are representative of three independent experiments. (D) Copy number of 16S rRNA from BCG isolated from auricular draining LN of WT and TCRδ−/− mice (n = 5 per group), 3 d after i.d. infection. Data are representative of two independent experiments.

Similar articles

Cited by

References

    1. Abadie V., Badell E., Douillard P., Ensergueix D., Leenen P.J.M., Tanguy M., Fiette L., Saeland S., Gicquel B., Winter N. 2005. Neutrophils rapidly migrate via lymphatics after Mycobacterium bovis BCG intradermal vaccination and shuttle live bacilli to the draining lymph nodes. Blood. 106:1843–1850 10.1182/blood-2005-03-1281 - DOI - PubMed
    1. Asarnow D.M., Kuziel W.A., Bonyhad M., Tigelaar R.E., Tucker P.W., Allison J.P. 1988. Limited diversity of [gamma][delta] antigen receptor genes of thy-1+ dendritic epidermal cells. Cell. 55:837–847 10.1016/0092-8674(88)90139-0 - DOI - PubMed
    1. Bergstresser P.R., Tigelaar R.E., Dees J.H., Streilein J.W. 1983. Thy-1 antigen-bearing dendritic cells populate murine epidermis. J. Invest. Dermatol. 81:286–288 10.1111/1523-1747.ep12518332 - DOI - PubMed
    1. Boismenu R., Havran W.L. 1994. Modulation of epithelial cell growth by intraepithelial gamma delta T cells. Science. 266:1253–1255 10.1126/science.7973709 - DOI - PubMed
    1. Bonneville M., O’Brien R.L., Born W.K. 2010. Gammadelta T cell effector functions: a blend of innate programming and acquired plasticity. Nat. Rev. Immunol. 10:467–478 10.1038/nri2781 - DOI - PubMed

Publication types

MeSH terms