

Dominant TNF-α+ Mycobacterium tuberculosis-specific CD4+ T cell responses discriminate between latent infection and active disease
- PMID: 21336285
- PMCID: PMC6570988
- DOI: 10.1038/nm.2299
Dominant TNF-α+ Mycobacterium tuberculosis-specific CD4+ T cell responses discriminate between latent infection and active disease
Abstract
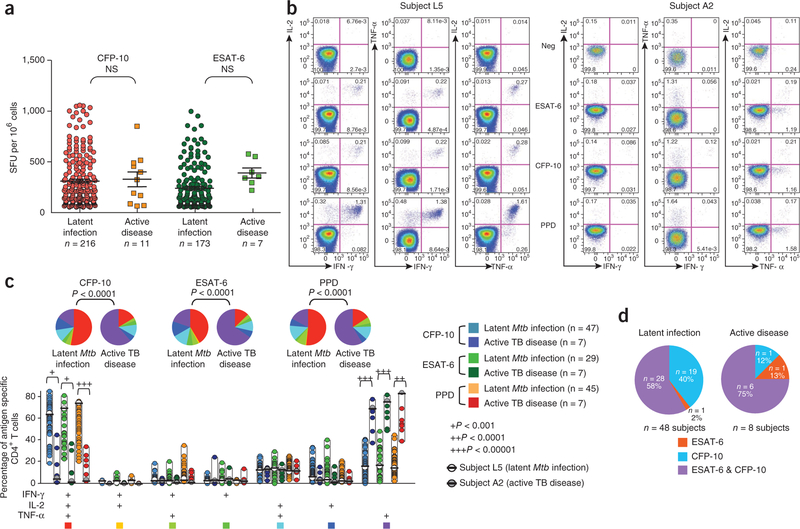
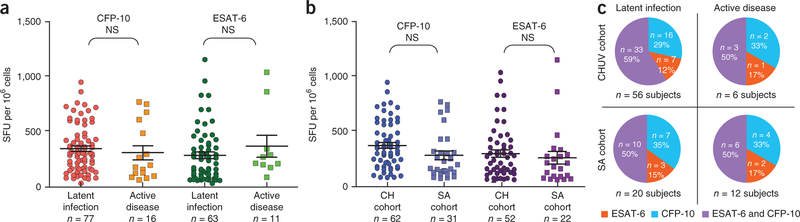
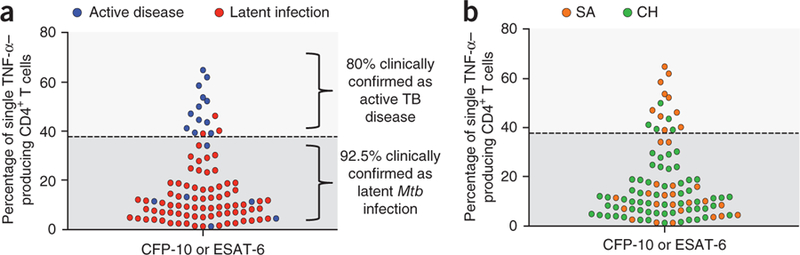
Rapid diagnosis of active Mycobacterium tuberculosis (Mtb) infection remains a clinical and laboratory challenge. We have analyzed the cytokine profile (interferon-γ (IFN-γ), tumor necrosis factor-α (TNF-α) and interleukin-2 (IL-2)) of Mtb-specific T cells by polychromatic flow cytometry. We studied Mtb-specific CD4+ T cell responses in subjects with latent Mtb infection and active tuberculosis disease. The results showed substantial increase in the proportion of single-positive TNF-α Mtb-specific CD4+ T cells in subjects with active disease, and this parameter was the strongest predictor of diagnosis of active disease versus latent infection. We validated the use of this parameter in a cohort of 101 subjects with tuberculosis diagnosis unknown to the investigator. The sensitivity and specificity of the flow cytometry-based assay were 67% and 92%, respectively, the positive predictive value was 80% and the negative predictive value was 92.4%. Therefore, the proportion of single-positive TNF-α Mtb-specific CD4+ T cells is a new tool for the rapid diagnosis of active tuberculosis disease.
Conflict of interest statement
COMPETING FINANCIAL INTERESTS
The authors declare no competing financial interests.
Figures

Similar articles
-
Activation Phenotype of Mycobacterium tuberculosis-Specific CD4+ T Cells Promoting the Discrimination Between Active Tuberculosis and Latent Tuberculosis Infection.Front Immunol. 2021 Aug 26;12:721013. doi: 10.3389/fimmu.2021.721013. eCollection 2021. Front Immunol. 2021. PMID: 34512645 Free PMC article.
-
Double- and monofunctional CD4⁺ and CD8⁺ T-cell responses to Mycobacterium tuberculosis DosR antigens and peptides in long-term latently infected individuals.Eur J Immunol. 2011 Oct;41(10):2925-36. doi: 10.1002/eji.201141602. Epub 2011 Aug 30. Eur J Immunol. 2011. PMID: 21728172
-
Measurement of phenotype and absolute number of circulating heparin-binding hemagglutinin, ESAT-6 and CFP-10, and purified protein derivative antigen-specific CD4 T cells can discriminate active from latent tuberculosis infection.Clin Vaccine Immunol. 2015 Feb;22(2):200-12. doi: 10.1128/CVI.00607-14. Epub 2014 Dec 17. Clin Vaccine Immunol. 2015. PMID: 25520147 Free PMC article.
-
Defining features of protective CD4 T cell responses to Mycobacterium tuberculosis.Curr Opin Immunol. 2014 Aug;29:137-42. doi: 10.1016/j.coi.2014.06.003. Curr Opin Immunol. 2014. PMID: 25000593 Free PMC article. Review.
-
Pathogenesis of Human Immunodeficiency Virus-Mycobacterium tuberculosis Co-Infection.J Clin Med. 2020 Nov 6;9(11):3575. doi: 10.3390/jcm9113575. J Clin Med. 2020. PMID: 33172001 Free PMC article. Review.
Cited by
-
Decreased expression of miR-21, miR-26a, miR-29a, and miR-142-3p in CD4⁺ T cells and peripheral blood from tuberculosis patients.PLoS One. 2013 Apr 16;8(4):e61609. doi: 10.1371/journal.pone.0061609. Print 2013. PLoS One. 2013. PMID: 23613882 Free PMC article.
-
Pathogen-specific T cell depletion and reactivation of opportunistic pathogens in HIV infection.Trends Immunol. 2012 May;33(5):207-14. doi: 10.1016/j.it.2012.01.011. Epub 2012 Mar 5. Trends Immunol. 2012. PMID: 22398371 Free PMC article.
-
Immune control of Mycobacterium tuberculosis is dependent on both soluble TNFRp55 and soluble TNFRp75.Immunology. 2021 Nov;164(3):524-540. doi: 10.1111/imm.13385. Epub 2021 Jul 8. Immunology. 2021. PMID: 34129695 Free PMC article.
-
Potential of host markers produced by infection phase-dependent antigen-stimulated cells for the diagnosis of tuberculosis in a highly endemic area.PLoS One. 2012;7(6):e38501. doi: 10.1371/journal.pone.0038501. Epub 2012 Jun 5. PLoS One. 2012. PMID: 22693640 Free PMC article.
-
Immunogenicity of PE18, PE31, and PPE26 proteins from Mycobacterium tuberculosis in humans and mice.Front Immunol. 2023 Dec 6;14:1307429. doi: 10.3389/fimmu.2023.1307429. eCollection 2023. Front Immunol. 2023. PMID: 38124744 Free PMC article.
References
-
- Kaufmann SH How can immunology contribute to the control of tuberculosis? Nat. Rev. Immunol 1, 20–30 (2001). - PubMed
-
- Flynn JL & Chan J Immunology of tuberculosis. Annu. Rev. Immunol 19, 93–129 (2001). - PubMed
-
- Lalvani A et al. Enhanced contact tracing and spatial tracking of Mycobacterium tuberculosis infection by enumeration of antigen-specific T cells. Lancet 357, 2017–2021 (2001). - PubMed
-
- Ewer K et al. Comparison of T cell-based assay with tuberculin skin test for diagnosis of Mycobacterium tuberculosis infection in a school tuberculosis outbreak. Lancet 361, 1168–1173 (2003). - PubMed
-
- Meier T, Eulenbruch HP, Wrighton-Smith P, Enders G & Regnath T Sensitivity of a new commercial enzyme-linked immunospot assay (T SPOT-TB) for diagnosis of tuberculosis in clinical practice. Eur. J. Clin. Microbiol. Infect. Dis 24, 529–536 (2005). - PubMed
Publication types
MeSH terms
Substances
Grants and funding
LinkOut - more resources
Full Text Sources
Other Literature Sources
Medical
Research Materials
