. 2011 Feb 16;31(7):2607-14.
doi: 10.1523/JNEUROSCI.5319-10.2011.

Large-scale calcium waves traveling through astrocytic networks in vivo

Affiliations

Large-scale calcium waves traveling through astrocytic networks in vivo

Nahoko Kuga et al. J Neurosci. .

Abstract

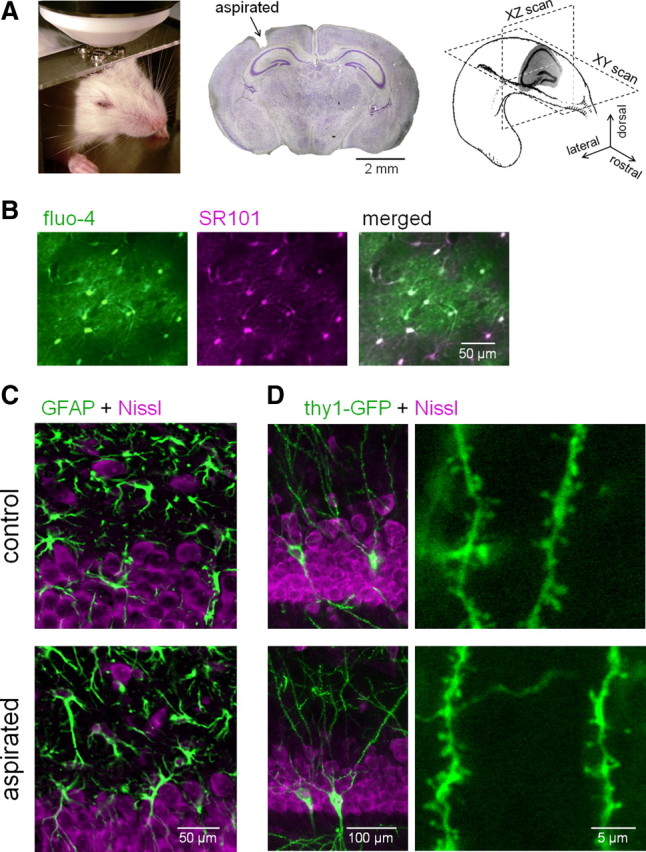
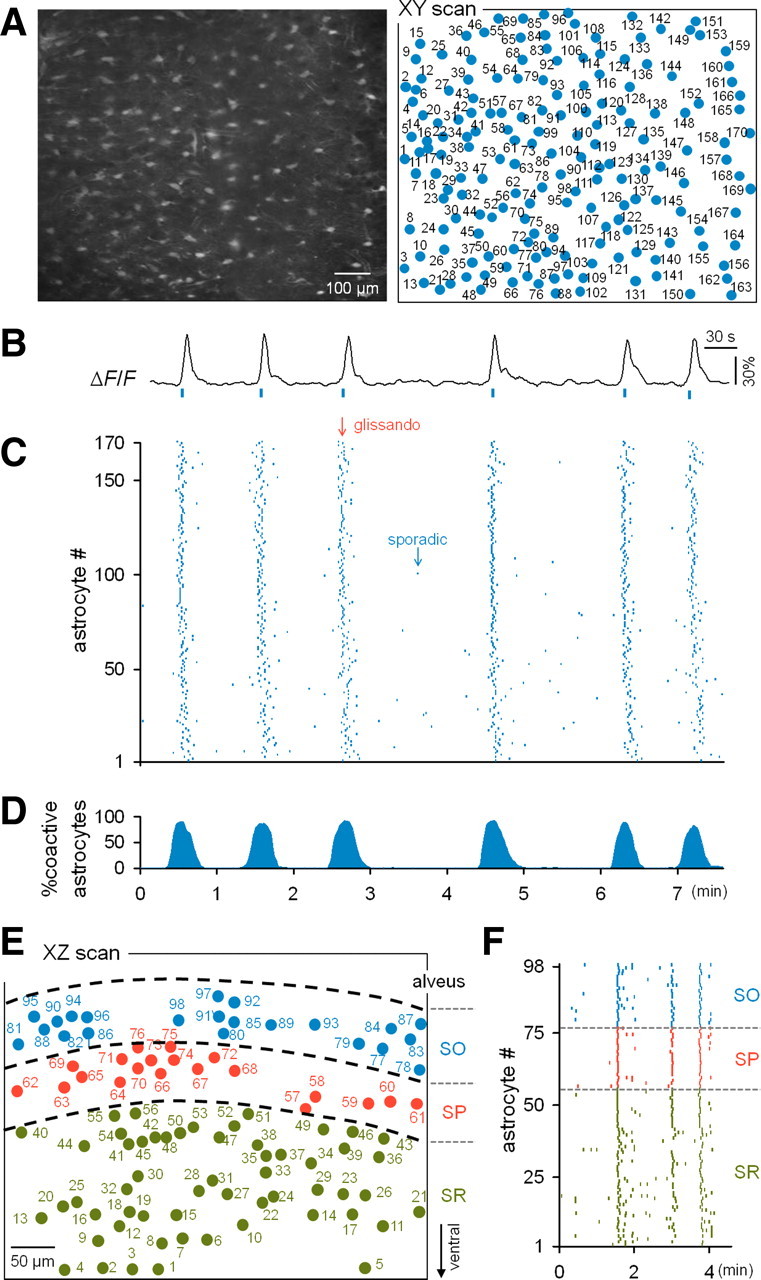
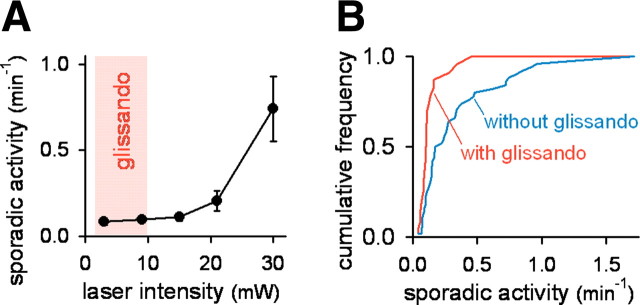
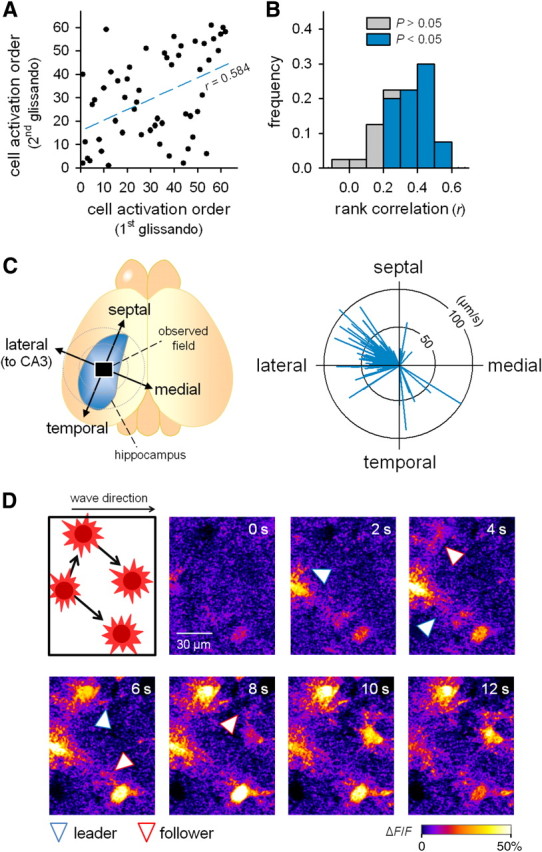
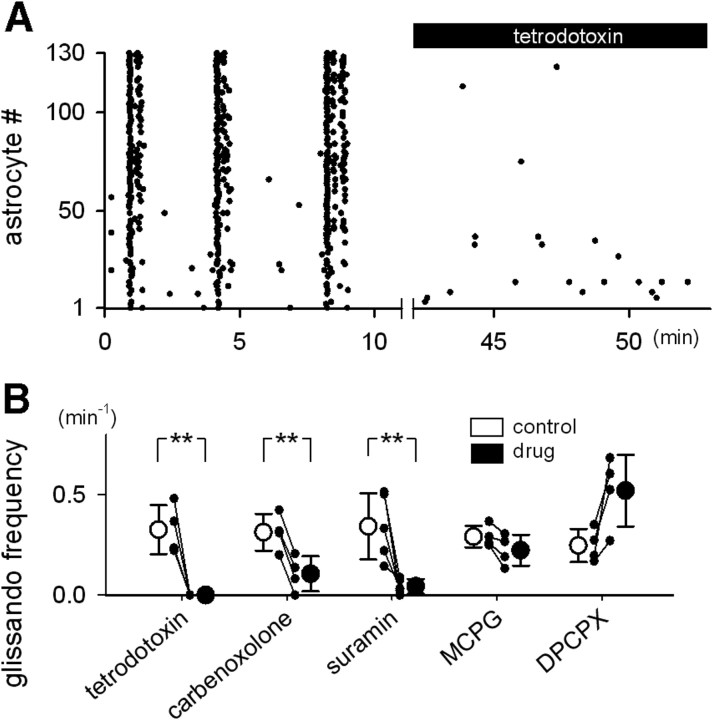
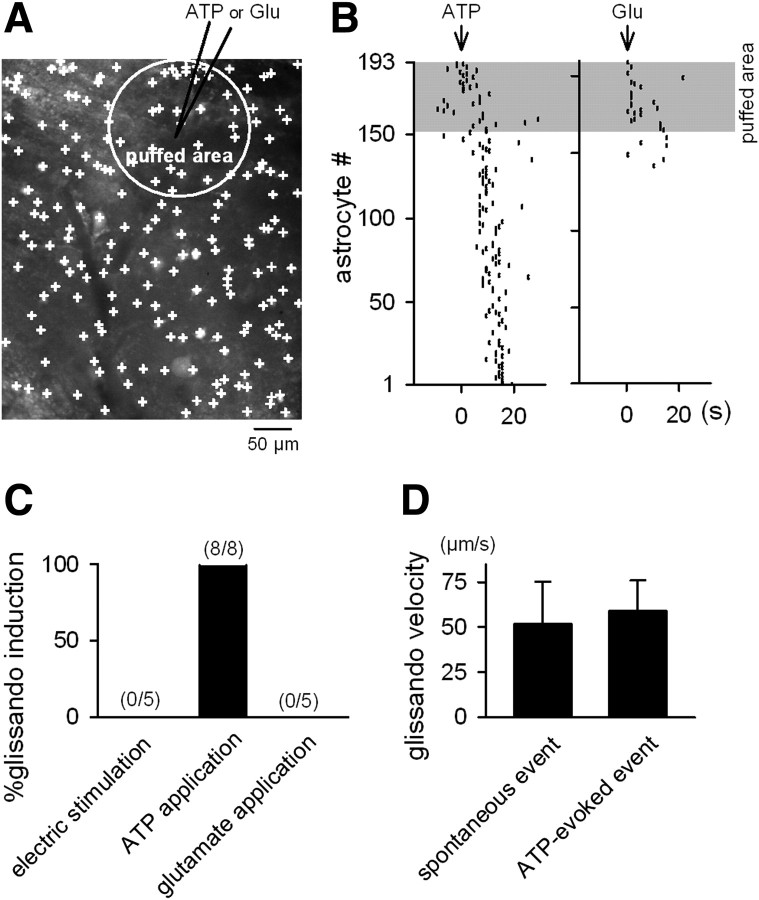
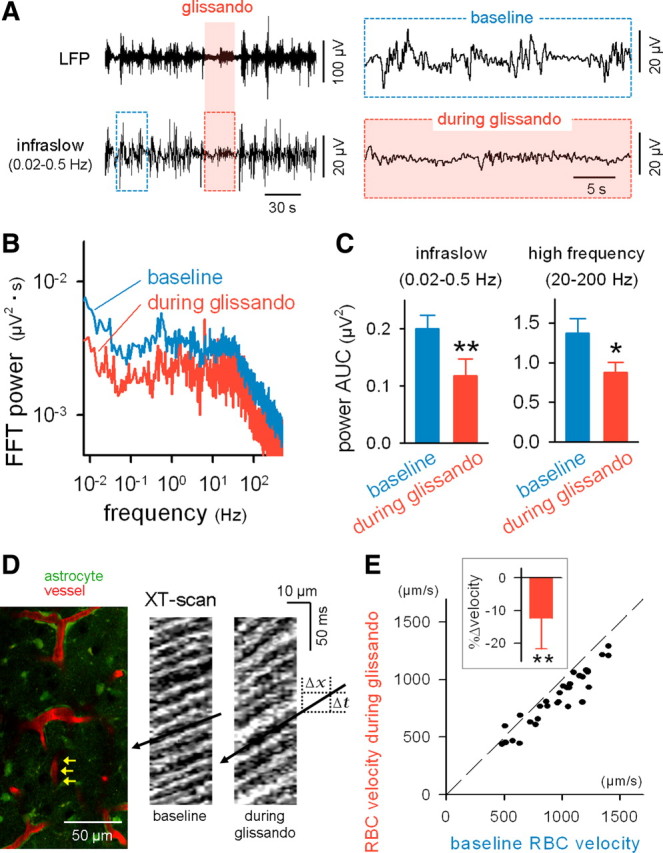
Macroscopic changes in cerebral blood flow, such as those captured by functional imaging of the brain, require highly organized, large-scale dynamics of astrocytes, glial cells that interact with both neuronal and cerebrovascular networks. However, astrocyte activity has been studied mainly at the level of individual cells, and information regarding their collective behavior is lacking. In this work, we monitored calcium activity simultaneously from hundreds of mouse hippocampal astrocytes in vivo and found that almost all astrocytes participated en masse in regenerative waves that propagated from cell to cell (referred to here as "glissandi"). Glissandi emerged depending on the neuronal activity and accompanied a reduction in infraslow fluctuations of local field potentials and a decrease in the flow of red blood cells. This novel phenomenon was heretofore overlooked, probably because of the high vulnerability of astrocytes to light damage; glissandi occurred only when observed at much lower laser intensities than previously used.


Figures

Figure 1.
Figure 1.
In vivo two-photon imaging of hippocampal astrocyte population. A, Two-photon images of astrocytes were obtained in an XY or XZ plane of the hippocampus in a head-restrained, urethane-anesthetized mouse. The middle photograph shows a Nissl-stained coronal section in which a small portion of the cerebral cortex has been aspirated to optically access the hippocampus. B, Two-photon images of cells loaded with SR101 and fluo-4. Fluo-4-loaded cells were positive for SR101, an astrocyte-specific marker. C, Comparison of GFAP-positive cells in the hippocampal CA1 stratum oriens between aspirated (bottom) and the contralateral (control; top) side. Fluorescent Nissl (magenta) was used for counterstaining. Neither an abnormal morphology nor an upregulation of GFAP occurred after aspiration. D, Comparison of Thy1-GFP-positive cells in the hippocampal CA1 stratum oriens between the aspirated side and the contralateral control side. Magnified images of the Thy1-GFP-positive basal dendrites are shown in the right panels. Neither dendritic swelling nor spine loss was induced by aspiration.
Figure 2.
Figure 2.
Calcium activities of astrocytes that were synchronized throughout the dorsal hippocampus. A, Two-photon image of an XY section of the stratum oriens in a fluo-4-loaded hippocampus (left) and the identified location of the somata of individual astrocytes. B, Typical trace of the calcium fluorescence intensity of a single astrocyte. C, Rastergram of the astrocytic activities recorded in A. Each dot indicates the timing of a single calcium event. Synchronous activities (glissandi) were evident in the background of sparse activities (sporadic). D, Percentage of active astrocytes at a given time (10 s bin). E, Map of astrocytes in an XZ section across the stratum oriens (SO), stratum pyramidale (SP), and stratum radiatum (SR) in the hippocampus. F, Rastergram of the astrocytes shown in E.
Figure 3.
Figure 3.
Glissandi are light-vulnerable. A, The relationship between the mean frequency of sporadic activities and the light intensity of the laser used for imaging. The activities increased with the laser intensity, and glissandi occurred only at the weakest laser intensities (shaded zone). Error bars indicate SD. B, Preparations that exhibited glissandi had lower frequencies of sporadic activity compared with those that did not demonstrate glissandi. Data are a compilation of 72 movies (35 mice; laser intensity, 8–30 mV).
Figure 4.
Figure 4.
Glissandi propagate from foot to foot in the CA1 to CA3 direction. A, Representative sequential plot showing the activation order of astrocytes in two successive glissandi (first glissando and second glissando). Each dot indicates a single astrocyte. The movie was obtained at 10 Hz to determine the precise order of cell activation. Spearman's rank correlation coefficient (r) was 0.584. B, Summary of the correlation coefficients for all pairwise data. Among 40 pairs in five glissandi, 32 (80%) exhibited a significance level of 5% for the rank correlation (colored). C, The direction and speed of glissandi were calculated using a linear regression and vector-plotted in the right circle graph. Each vector represents a single glissando, and its orientation and length indicate the direction and speed of propagation (n = 38 glissandi, 8 mice). D, Two-photon imaging with a higher magnification and a higher numerical aperture objective (25×, 1.05 NA) revealed that calcium activity propagated from a leader foot of one cell to the neighboring follower foot of another cell during the propagation of a glissando. The blue and red arrowheads indicate leader feet (donors) and follower feet (recipients), respectively. Similar microscopic patterns of propagation were observed in all three animals tested.
Figure 5.
Figure 5.
Glissandi depend on neuronal activity, ATP receptors, and gap junctions. A, After monitoring glissandi under control conditions, the alveus surface of the hippocampus was treated with 2 μm tetrodotoxin, and the astrocytes were reobserved. Tetrodotoxin blocked the generation of glissandi. B, Summary of the pharmacological characterization. Glissandi were inhibited by tetrodotoxin (2 μm; n = 4 mice), carbenoxolone (250 μm; n = 4 mice), and suramin (1 mm; n = 5 mice), but not by MCPG (1 mm; n = 4 mice) or DPCPX (1 mg/kg, i.p.; n = 4 mice). **p < 0.01 versus control, paired t test. Error bars indicate SD.
Figure 6.
Figure 6.
Local application of ATP evokes glissandi. A, An XY-scan image of astrocytes in the CA1 stratum oriens, in which a glass pipette (7–9 MΩ) loaded with 1 mm ATP or 1 mm glutamate (Glu) was inserted into the CA1 stratum pyramidale. The agonists were pressure-ejected, and the puffed area was identified by spread of fluorescence of the coapplied Alexa Fluor 568 (white circle). B, Representative data showing the effect of the local application of ATP (left) and glutamate (right). The shaded area indicates the puffed area. ATP induced a glissando, whereas glutamate activated only astrocytes located in the puffed area, and these activities did not propagate. C, Ratios of trials that successfully induced glissando via a local application of ATP and glutamate and electric stimulation (100 pulses at 100 Hz, 100 μs rectangular pulses at 100 μA). The data for four mice are summarized. D, No significant difference in the glissando velocity between spontaneously occurring and ATP-evoked glissandi (Student's t test; n = 38 and 8 glissandi, respectively). Error bars indicate SD.
Figure 7.
Figure 7.
Glissandi are correlated with a reduced infraslow potential and a slowed cerebral vessel flow. A, LFPs were recorded from the CA1 stratum radiatum while monitoring the glissandi. The raw LFP trace (top) was band-filtered (0.02–0.5 Hz) to extract infraslow fluctuations (bottom). Glissandi were generated during the shaded period. The boxed regions are expanded in the insets. B, Fast Fourier transform (FFT) of LFPs during periods of baseline and glissandi. C, During glissandi, the area under the curves (AUCs) of the FFT power decreased in the ranges of 0.02–0.5 and 20–200 Hz. *p < 0.05, **p < 0.01 versus baseline (n = 5). Error bars indicate SD. D, FITC-dextran was intravenously injected, and astrocytic calcium and blood vessel flows were monitored simultaneously (left). The flow of individual RBCs was measured from capillaries (such as indicated by arrows). Two right kymographs show XT-line-scanned images along the longitudinal axes of a capillary during periods of baseline and glissandi. The RBC flow is observed as oblique shadow bands, and the RBC velocity is calculated as the slope ΔXT. E, Comparison of the RBC velocity between periods of baseline and glissandi. The dots indicate the data obtained for single capillaries (i.e., single glissandi), and the broken line indicates the diagonal. The inset shows the glissando-induced mean change in RBC velocity. **p < 0.001 versus baseline, t(31) = 7.7, paired t test (n = 32 events, 5 mice). Error bars indicate SD.

Similar articles

Cited by

References

    1. Aguado F, Espinosa-Parrilla JF, Carmona MA, Soriano E. Neuronal activity regulates correlated network properties of spontaneous calcium transients in astrocytes in situ. J Neurosci. 2002;22:9430–9444. - PMC - PubMed
    1. Agulhon C, Petravicz J, McMullen AB, Sweger EJ, Minton SK, Taves SR, Casper KB, Fiacco TA, McCarthy KD. What is the role of astrocyte calcium in neurophysiology? Neuron. 2008;59:932–946. - PMC - PubMed
    1. Agulhon C, Fiacco TA, McCarthy KD. Hippocampal short- and long-term plasticity are not modulated by astrocyte Ca2+ signaling. Science. 2010;327:1250–1254. - PubMed
    1. Basarsky TA, Duffy SN, Andrew RD, MacVicar BA. Imaging spreading depression and associated intracellular calcium waves in brain slices. J Neurosci. 1998;18:7189–7199. - PMC - PubMed
    1. Bekar LK, He W, Nedergaard M. Locus coeruleus alpha-adrenergic-mediated activation of cortical astrocytes in vivo. Cereb Cortex. 2008;18:2789–2795. - PMC - PubMed

Publication types

MeSH terms