. 2011 Apr 8;286(14):12328-39.
doi: 10.1074/jbc.M110.176099. Epub 2011 Feb 15.

A Runx2/miR-3960/miR-2861 regulatory feedback loop during mouse osteoblast differentiation

Affiliations

A Runx2/miR-3960/miR-2861 regulatory feedback loop during mouse osteoblast differentiation

Rong Hu et al. J Biol Chem. .

Abstract

Our recent study showed that miR-2861 promotes osteoblast differentiation by targeting histone deacetylase 5, resulting in increased runt-related transcription factor 2 (Runx2) protein production. Here we identified another new microRNA (miRNA) (miR-3960) that played a regulatory role in osteoblast differentiation through a regulatory feedback loop with miR-2861. miR-3960 and miR-2861 were found clustered at the same loci. miR-3960 was transcribed during bone morphogenic protein 2 (BMP2)-induced osteogenesis of ST2 stromal cells. Overexpression of miR-3960 promoted BMP2-induced osteoblastogenesis. However, the inhibition of miR-3960 expression attenuated the osteoblastogenesis. Homeobox A2 (Hoxa2), a repressor of Runx2 expression, was confirmed to be a target of miR-3960. Electrophoretic mobility shift assay and chromatin immunoprecipitation experiments confirmed that Runx2 bound to the promoter of the miR-3960/miR-2861 cluster. Furthermore, overexpression of Runx2 induced miR-3960/miR-2861 transcription, and block of Runx2 expression attenuated BMP2-induced miR-3960/miR-2861 transcription. Here we report that miR-3960 and miR-2861, transcribed together from the same miRNA polycistron, both function in osteoblast differentiation through a novel Runx2/miR-3960/miR-2861 regulatory feedback loop. Our findings provide new insights into the roles of miRNAs in osteoblast differentiation.


Figures

FIGURE 1.
FIGURE 1.
Expression profile of miR-3960. A, sequence of mouse miR-3960. B, schematic graph of the secondary structure of pre-miR-3960. The structure was predicted by Mfold, and the sequence of mature miR-3960 is shown by shadowed circles. C, graphic representation of the cluster of miR-3960 and miR-2861 on mouse chromosome 2. D, Northern blot analysis of the expression of miR-3960 in osteoblast, osteoclast, and different mouse tissues. E, Northern blot analysis showed the time-dependent expression of miR-3960 during BMP2-induced ST2 osteogenic differentiation after treatment with BMP2 (300 ng/ml) for the indicated times. U6 snRNA was used as a loading control. Bar, mean ± S.D. (*, p < 0.05 versus U6; n = 5).
FIGURE 2.
FIGURE 2.
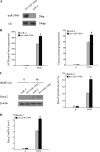
miR-3960 promoted BMP2-induced ST2 osteoblast differentiation. A, Northern blot analysis of miR-3960 expression in ST2 cells transfected with pre-miR-3960 or miR-C (control). B, overexpression of miR-3960 enhanced BMP2-induced ST2 osteoblast differentiation. ST2 cells were stably transfected with pre-miR-3960 or miR-C and then treated with BMP2 (300 ng/ml) for 48 h. The bar graphs show the increase of ALP activity and osteocalcin secretion after transfection of pre-miR-3960 (mean ± S.D.; *, p < 0.05 versus miR-C; n = 5). C, Runx2 protein expression was determined by Western blot. The bar graph represents the ratio of Runx2/β-actin by densitometry (mean ± S.D.; *, p < 0.05 versus miR-C; n = 5). D, levels of Runx2 mRNA were measured by qRT-PCR. The bar graph indicates the -fold induction of Runx2 mRNA expression in pre-miR-3960-transfected ST cells compared with the control (mean ± S.D.; *, p < 0.05 versus miR-C; n = 5).
FIGURE 3.
FIGURE 3.
Inhibition of miR-3960 diminished BMP2-induced ST2 osteoblast differentiation. ST2 cells were treated with BMP2 and transiently transfected with anti-miR-3960 or anti-miR-C. A, ALP activity and osteocalcin secretion were reduced after transfection of anti-miR-3960 for 48 h. B, the levels of Runx2 protein were decreased by anti-miR-3960 transfection. C, the decreased expression of Runx2 mRNA after anti-miR-3960 transfection. The error bars represent the mean ± S.D. (*, p < 0.05 versus anti-miR-C; n = 5).
FIGURE 4.
FIGURE 4.
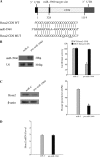
miR-3960 directly targeted Hoxa2. A, schematic representing the putative target site of miR-3960 in mouse Hoxa2 CDS and the base pairing of miR-3960 sequences with wild-type (WT) and mutant (MUT) CDS regions of Hoxa2. Three mutations are underlined. B, miR-3960 targeted the Hoxa2 CDS. ST2 cells were cotransfected with the luciferase reporters carrying wild-type Hoxa2 CDS (WT-Hoxa2-CDS) or mutated Hoxa2 CDS (MUT-Hoxa2-CDS) and pre-miR-3960 or miR-C for 48 h. On the left, Northern blot analysis showed that miR-3960 was overexpressed in ST2 cells transfected with pre-miR-3960. On the right, the bar chart shows the luciferase activities. Concurrent transfection of pre-miR-3960 decreased the reporter activity of WT-Hoxa2-CDS but not the reporter activity of MUT-Hoxa2-CDS. The error bars represent the mean ± S.D. (*, p < 0.05 versus MUT-Hoxa2-CDS; n = 3). C, miR-3960 repressed Hoxa2 expression post-transcriptionally. ST2 cells were transfected with 100 nm pre-miR-3960 or miR-C. Western blot showed the reduced Hoxa2 protein expression by miR-3960 overexpression. Results are indicated as the ratio of Hoxa2/β-actin by densitometry. D, quantitative RT-PCR was used to determine the levels of Hoxa2 mRNA 48 h after transfection. The error bars represent the mean ± S.D. (*, p < 0.05 versus miR-C; n = 5).
FIGURE 5.
FIGURE 5.
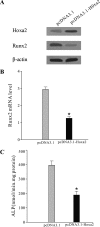
Effect of Hoxa2 overexpression on Runx2 production in ST2 cells. ST2 cells were stably transfected with Hoxa2 expression vector (pcDNA3.1-Hoxa2) or control empty vector (pcDNA3.1) and then treated with BMP-2 (300 ng/ml) for 48 h. A, effect of Hoxa2 overexpression on Hoxa2 and Runx2 expression. Hoxa2 and Runx2 expression was determined by Western blot analysis. B, the levels of Runx2 mRNA by qRT-PCR in cells transfected with pcDNA3.1-Hoxa2 or pcDNA3.1. C, ALP activity was reduced after transfection of Hoxa2 expression vector. The error bars represent the mean ± S.D. (*, p < 0.05 versus pcDNA3.1 control; n = 5).
FIGURE 6.
FIGURE 6.
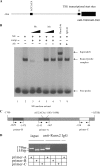
Analysis of Runx2 binding to promoter of miR-3960/miR-2861 cluster. A, a Runx2 binding site was located upstream of the miR-3960/miR-2861 cluster. The schematic represents the genomic region upstream of the miR-3960/miR-2861 cluster. One Runx2 putative binding site upstream of the miR-3960/miR-2861 cluster is indicated. B, EMSA for Runx2 binding to the promoter of the miR-3960/miR-2861 cluster. Electrophoretic mobility shift assays were performed using labeled oligonucleotide probes derived from the promoter of miR-3960/miR-2861 of BMP2-induced ST2 cells. The labeled oligonucleotide probes (WT Oligo 1) were incubated alone (lane 1), in combination with nuclear extracts (NE; lane 2), in the presence of 10- or 100-fold molar excess of specific unlabeled competitor probe (WT Oligo 1) (comp; lanes 3 and 4) or unlabeled mutant (Mt) competitor probe (comp; mutant Oligo 1) (lanes 5 and 6), and in the presence of the Runx2 antibody (anti-Runx2) (Ab; lane 7) or IgG control antibody (Ab; lane 8). C, schematic representation of the promoter region of the miR-3960/miR-2861 cluster. The positions of the Runx2 binding site and primer sites for ChIP assays are indicated. D, ChIP assay showed Runx2 binding to the miR-3960/miR-2861 cluster in BMP2-induced ST2 cells through the putative Runx2 binding site. ChIP assays were performed using no antibodies (input; lanes 1, 2, and 3), Runx2 antibodies (lanes 4, 5, and 6), and control IgG antibody (lane 7). Primer-B (−1629/−1475; lanes 2 and 5) and primer-C (−238/−84, lanes 3 and 6) were used as negative controls for PCR.
FIGURE 7.
FIGURE 7.
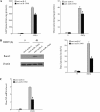
Effects of Runx2 overexpression or knockdown on miR-3960 and miR-2861 expression. A, ST2 cells were transfected with Runx2 pcDNA3.1 vector (pcDNA3.1-Runx2) or pcDNA3.1 vector control. Western blot analysis showed that Runx2 protein levels were elevated after transfection for 48 h. Northern blot represents miR-3960 and miR-2861 expression levels in control or Runx2-overexpressing cells at 48 h after transfection. B, knockdown of Runx2 attenuated BMP2-induced miR-3960 and miR-2861 expression. ST2 cells were transfected with si-Runx2 or siRNA control (si-C) and then cultured with BMP2 for 48 h. Total cellular protein was subjected to Western blot analysis using anti-Runx2 antibody. Northern blot revealed miR-3960 and miR-2861 expression using total RNA isolated from ST2 cells at 48 h after transfection.
FIGURE 8.
FIGURE 8.
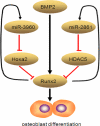
Graphic representation of autoregulatory feedback loop between Runx2 and miR-3960/miR-2861 cluster. Osteoblast differentiation signals lead to the activation of Runx2 transcription factor in stromal cells. In addition to induction of genes essential for osteoblast differentiation, Runx2 transactivates miR-3960/miR-2861. In turn, miR-3960 and miR-2861 maintain the levels of Runx2 mRNA and protein via repressing Hoxa2 and histone deacetylase 5 (HDAC5) and stabilizing the osteoblast differentiation.

Similar articles

Cited by

References

    1. Bartel D. P. (2004) Cell 116, 281–297 - PubMed
    1. Carthew R. W., Sontheimer E. J. (2009) Cell 136, 642–655 - PMC - PubMed
    1. Lewis B. P., Burge C. B., Bartel D. P. (2005) Cell 120, 15–20 - PubMed
    1. Ambros V., Chen X. (2007) Development 134, 1635–1641 - PubMed
    1. Hagen J. W., Lai E. C. (2008) Cell Cycle 7, 2327–2332 - PMC - PubMed

Publication types

MeSH terms