Involvement of glutamate in rest-stimulus interaction between perigenual and supragenual anterior cingulate cortex: a combined fMRI-MRS study
- PMID: 21305662
- PMCID: PMC6870441
- DOI: 10.1002/hbm.21179
Involvement of glutamate in rest-stimulus interaction between perigenual and supragenual anterior cingulate cortex: a combined fMRI-MRS study
Abstract
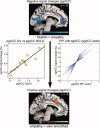
The brain shows a high degree of activity at rest. The significance of this activity has come increasingly into focus. At present, however, the interaction between this activity and stimulus-induced activity is not well defined. The interaction between a task-negative (perigenual anterior cingulate cortex, pgACC) and task-positive (supragenual anterior cingulate cortex, sgACC) region during a simple task was thus investigated using a combination of fMRI and MRS. Negative BOLD responses in the pgACC were found to show a unidirectional effective connectivity with task-induced positive BOLD responses in the sgACC. This connectivity was shown to be related specifically with glutamate levels in the pgACC. These results demonstrate an interaction between deactivation from resting-state and resting-state glutamate levels in a task-negative region (pgACC), and task-induced activity in a task-positive region (sgACC). This provides insight into the neuronal and biochemical mechanisms by means of which the resting state activity of the brain potentially impacts upon subsequent stimulus-induced activity.
Copyright © 2011 Wiley Periodicals, Inc.
Figures


Similar articles
-
Glutamate modulates resting state activity in the perigenual anterior cingulate cortex - a combined fMRI-MRS study.Neuroscience. 2012 Dec 27;227:102-9. doi: 10.1016/j.neuroscience.2012.09.039. Epub 2012 Sep 25. Neuroscience. 2012. PMID: 23022216
-
Localized Prediction of Glutamate from Whole-Brain Functional Connectivity of the Pregenual Anterior Cingulate Cortex.J Neurosci. 2020 Nov 18;40(47):9028-9042. doi: 10.1523/JNEUROSCI.0897-20.2020. Epub 2020 Oct 12. J Neurosci. 2020. PMID: 33046545 Free PMC article.
-
Resting state functional connectivity of the hippocampus along the anterior-posterior axis and its association with glutamatergic metabolism.Cortex. 2016 Aug;81:104-17. doi: 10.1016/j.cortex.2016.03.022. Epub 2016 Apr 22. Cortex. 2016. PMID: 27182810
-
Acute effects of ketamine on the pregenual anterior cingulate: linking spontaneous activation, functional connectivity, and glutamate metabolism.Eur Arch Psychiatry Clin Neurosci. 2022 Jun;272(4):703-714. doi: 10.1007/s00406-021-01377-2. Epub 2022 Jan 12. Eur Arch Psychiatry Clin Neurosci. 2022. PMID: 35020021 Free PMC article.
-
Neurotransmitter changes during interference task in anterior cingulate cortex: evidence from fMRI-guided functional MRS at 3 T.Brain Struct Funct. 2016 Jun;221(5):2541-51. doi: 10.1007/s00429-015-1057-0. Epub 2015 May 15. Brain Struct Funct. 2016. PMID: 25976598
Cited by
-
Glutamate concentration of medial prefrontal cortex is inversely associated with addictive behaviors: a translational study.Transl Psychiatry. 2024 Oct 12;14(1):433. doi: 10.1038/s41398-024-03145-x. Transl Psychiatry. 2024. PMID: 39396023 Free PMC article.
-
GABA decrease is associated with degraded neural specificity in the visual cortex of glaucoma patients.Commun Biol. 2023 Jun 29;6(1):679. doi: 10.1038/s42003-023-04918-8. Commun Biol. 2023. PMID: 37386293 Free PMC article.
-
Association of default-mode network neurotransmitters and inter-network functional connectivity in first episode psychosis.Neuropsychopharmacology. 2023 Apr;48(5):781-788. doi: 10.1038/s41386-023-01546-y. Epub 2023 Feb 14. Neuropsychopharmacology. 2023. PMID: 36788375 Free PMC article.
-
Intrinsic Connectivity Networks of Glutamate-Mediated Antidepressant Response: A Neuroimaging Review.Front Psychiatry. 2022 May 26;13:864902. doi: 10.3389/fpsyt.2022.864902. eCollection 2022. Front Psychiatry. 2022. PMID: 35722550 Free PMC article. Review.
-
Neurophysiological Effects of the Anterior Cingulate Cortex on the Exacerbation of Crohn's Disease: A Combined fMRI-MRS Study.Front Neurosci. 2022 May 6;16:840149. doi: 10.3389/fnins.2022.840149. eCollection 2022. Front Neurosci. 2022. PMID: 35600612 Free PMC article.
References
-
- Alcaro A, Panksepp J, Witczak J, Hayes DJ, Northoff G ( 2010): Is subcortical‐cortical midline activity in depression mediated by glutamate and GABA? A cross‐species translational approach. Neurosci Biobehav Rev 34: 592–605. - PubMed
-
- Anand A, Li Y, Wang Y, Wu J, Gao S, Bukhari L, Mathews VP, Kalnin A, Lowe MJ ( 2005): Activity and connectivity of brain mood regulating circuit in depression: A functional magnetic resonance study. Biol Psychiatry 57: 1079–1088. - PubMed
-
- Arieli A, Sterkin A, Grinvald A, Aertsen A ( 1996): Dynamics of ongoing activity: Explanation of the large variability in evoked cortical responses. Science 273: 1868–1871. - PubMed
-
- Aron AR ( 2007): The neural basis of inhibition in cognitive control. Neuroscientist 13: 214–228. - PubMed
Publication types
MeSH terms
Substances
LinkOut - more resources
Full Text Sources

