. 2011 Feb;22(2):262-73.
doi: 10.1681/ASN.2010040352.

The tuberin/mTOR pathway promotes apoptosis of tubular epithelial cells in diabetes

Affiliations

The tuberin/mTOR pathway promotes apoptosis of tubular epithelial cells in diabetes

Chakradhar Velagapudi et al. J Am Soc Nephrol. 2011 Feb.

Abstract

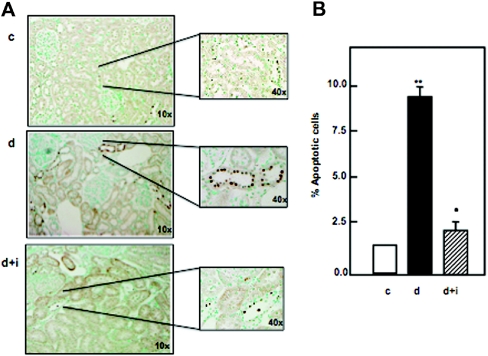
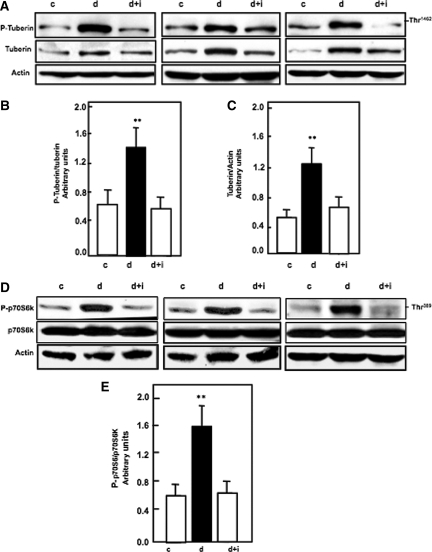
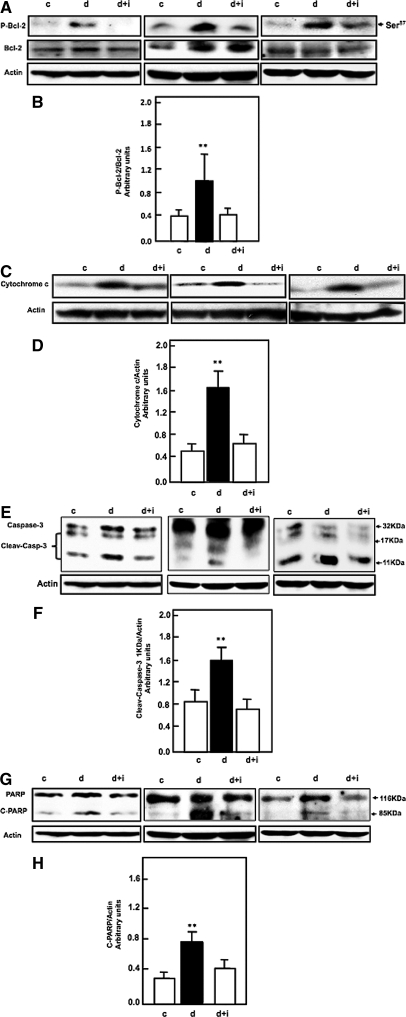
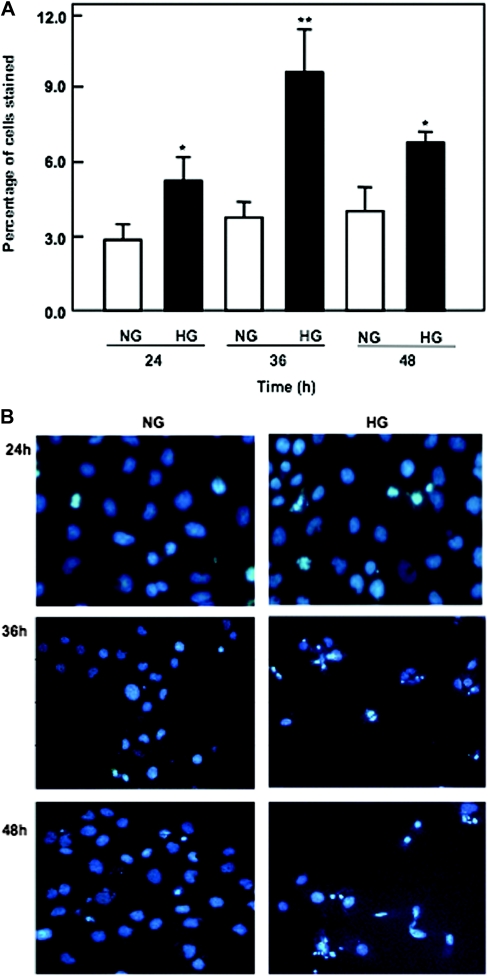
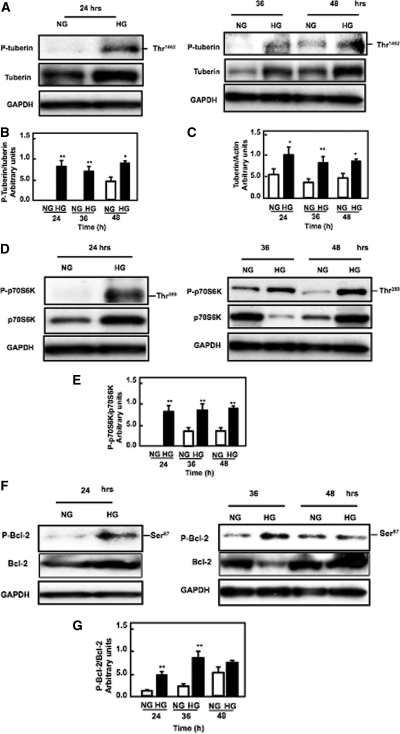
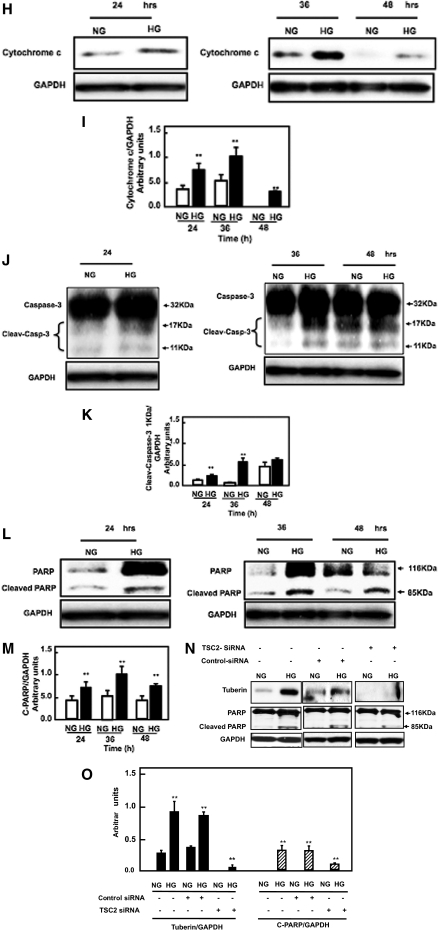
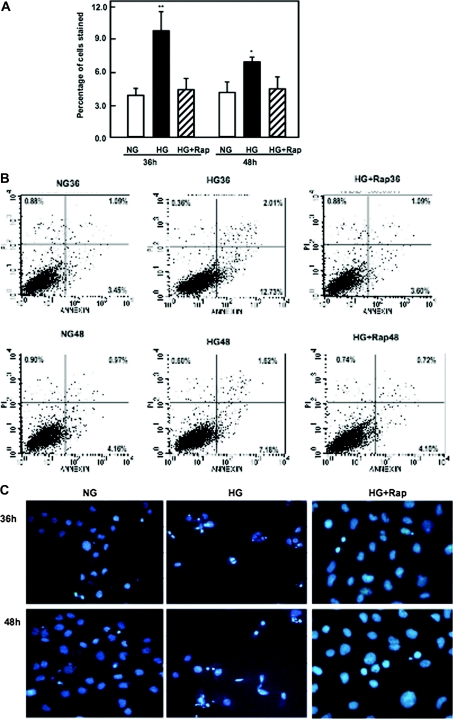
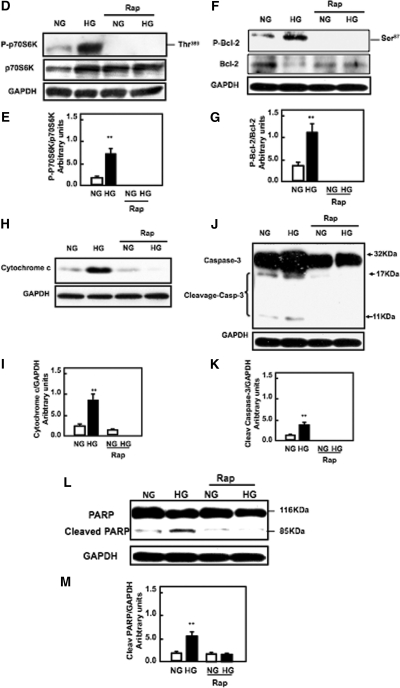
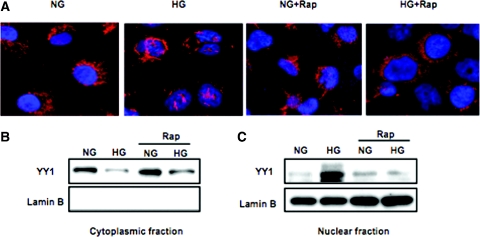
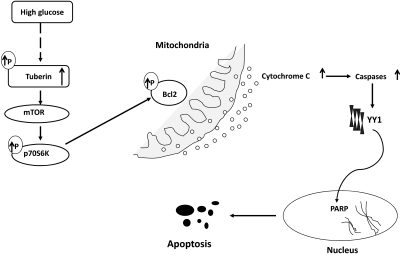
Apoptosis contributes to the development of diabetic nephropathy, but the mechanism by which high glucose (HG) induces apoptosis is not fully understood. Because the tuberin/mTOR pathway can modulate apoptosis, we studied the role of this pathway in apoptosis in type I diabetes and in cultured proximal tubular epithelial (PTE) cells exposed to HG. Compared with control rats, diabetic rats had more apoptotic cells in the kidney cortex. Induction of diabetes also increased phosphorylation of tuberin in association with mTOR activation (measured by p70S6K phosphorylation), inactivation of Bcl-2, increased cytosolic cytochrome c expression, activation of caspase 3, and cleavage of PARP; insulin treatment prevented these changes. In vitro, exposure of PTE cells to HG increased phosphorylation of tuberin and p70S6K, phosphorylation of Bcl-2, expression of cytosolic cytochrome c, and caspase 3 activity. High glucose induced translocation of the caspase substrate YY1 from the cytoplasm to the nucleus and enhanced cleavage of PARP. Pretreatment the cells with the mTOR inhibitor rapamycin reduced the number of apoptotic cells induced by HG and the downstream effects of mTOR activation noted above. Furthermore, gene silencing of tuberin with siRNA decreased cleavage of PARP. These data show that the tuberin/mTOR pathway promotes apoptosis of tubular epithelial cells in diabetes, mediated in part by cleavage of PARP by YY1.


Figures

Figure 1.
Figure 1.
Diabetes is associated with increased apoptosis in kidney cortex of rats, and insulin treatment significantly decreases these changes. (A) Kidney sections of control, diabetes, and diabetes+insulin of rats were stained by TUNEL. There is an increase in TUNEL-positive cells to five- to sixfold in diabetic rats compared with control rats. Insulin treatment of diabetic rats (see Results) significantly decreases the apoptosis. (B) Percentage of total number of TUNEL-positive cells counted in kidney sections of control, diabetes, and diabetes+insulin of rats. Significant difference from control animals is indicated by **P < 0.01 and *P < 0.05.
Figure 2.
Figure 2.
Diabetes increases the phosphorylation of tuberin and activates the mTOR pathway, and insulin treatment reverses it to control levels. (A) Representative immunoblot shows that diabetes (d) enhances the phosphorylation of tuberin at Thr1462 in kidney cortex of rats. Treatment of the diabetic rats with insulin (d+i) reversed the changes to control (c) levels. Actin was used as a loading control. (B) Histograms in the bottom panel show increased phospho tuberin/tuberin expression in diabetic animals and (C) increased total tuberin/actin expression in diabetic animals. (D) Increase in phosphorylation tuberin (P-Tuberin) is associated with increased activation of the mTOR pathway by phosphorylation S70S6K (P-S70S6K) at Thr389 in kidney cortex in diabetic rats compared with control rats. Insulin treatment (d+i) reversed these changes to control levels. Actin was used as a loading control. (E) Histogram shows levels of phospho-p70S6K/total p-70S6K. Histograms represent means ± SE of four animals. Significant difference from control animals is indicated by **P < 0.01. Western blot was repeated two times for each animal.
Figure 3.
Figure 3.
Diabetes is associated with increased apoptosis cascade signals, and insulin treatment restores these changes to the control levels. (A and B) Diabetes enhanced phosphorylation of Bcl-2 at Ser87 (C and D), increased in cytosolic cytochrome c expression (E and F), increased cleavage of caspase-3 at 11 kD, and (G and H) increased cleavage of PARP at 85 kD, and insulin treatment reversed theses changes to control levels in rats. Actin was used as a loading control. Histogram shows representative means ± SE of four animals. Significant difference from control animals is indicated by **P < 0.01. Western blot was repeated two times for each animal.
Figure 4.
Figure 4.
High glucose induces apoptosis of proximal tubular epithelial cells. (A) Data represent annexin V binding and PI staining of cells exposed to high glucose concentration (25 mM). Serum-starved cells were exposed to glucose for the time periods indicated. Cells were harvested and stained with FITC-conjugated annexin V and PI for 15 minutes. The cells were analyzed by flow cytometer as described in Concise Methods. Maximum number of apoptotic cells was shown at 36 hours after high glucose treatment. (B) Cells were plated on a two-chamber slide. Serum-starved cells were treated with normal or high glucose for various time points as indicated. Apoptotic nuclei were detected using Hoechst 33258 (Sigma) staining and analyzed by fluorescence microscopy at 350-nm excitation and 460-nm emission. Annexin and Hoechst staining were repeated four times for each time point. *P < 0.05, **P < 0.01.
Figure 5.
Figure 5.
High glucose increases tuberin phsophorylation and mTOR activation to activate apoptosis signal pathways in proximal tubular epithelial HK2 cells. (A) Representative immunoblot shows an increase in phospho-tuberin (p-tuberin) and total tuberin. (B and C) Histograms in the bottom panel show increase in phospho-tuberin/tuberin expression and increase in total tuberin/actin expression in cells treated with high glucose for the time periods indicated. (D) Representative immunoblot shows an increase in phopho-p70S6K (P-p70S6K) in HK2 cells treated with high glucose (25 mM glucose d-glucose) for the time periods indicated. (E) Histograms show increased P-p70S6K/p70S6K. (F and G) High glucose enhances phosphorylation of Bcl-2, (H and I) increases cytosolic cytochrome c expression, (J and K) increases cleavage of caspase at 11 kD, and (L and M) increases cleavage of PARP at 85 kD in HK2 cells treated for the time periods indicated. Glyceraldehyde 3-phosphate dehydrogenase (GAPDH) was used as a loding control. Western blot was repeated three times for each time point. (N and O) Cells transfected with siRNA against tuberin (TSC2) and treated with low or high glucose show significant decrease in tuberin protein expression and decrease in cleavage of PARP. *P < 0.05, **P < 0.01.
Figure 5.
Figure 5.
High glucose increases tuberin phsophorylation and mTOR activation to activate apoptosis signal pathways in proximal tubular epithelial HK2 cells. (A) Representative immunoblot shows an increase in phospho-tuberin (p-tuberin) and total tuberin. (B and C) Histograms in the bottom panel show increase in phospho-tuberin/tuberin expression and increase in total tuberin/actin expression in cells treated with high glucose for the time periods indicated. (D) Representative immunoblot shows an increase in phopho-p70S6K (P-p70S6K) in HK2 cells treated with high glucose (25 mM glucose d-glucose) for the time periods indicated. (E) Histograms show increased P-p70S6K/p70S6K. (F and G) High glucose enhances phosphorylation of Bcl-2, (H and I) increases cytosolic cytochrome c expression, (J and K) increases cleavage of caspase at 11 kD, and (L and M) increases cleavage of PARP at 85 kD in HK2 cells treated for the time periods indicated. Glyceraldehyde 3-phosphate dehydrogenase (GAPDH) was used as a loding control. Western blot was repeated three times for each time point. (N and O) Cells transfected with siRNA against tuberin (TSC2) and treated with low or high glucose show significant decrease in tuberin protein expression and decrease in cleavage of PARP. *P < 0.05, **P < 0.01.
Figure 6.
Figure 6.
Rapamycin inhibits mTOR activation and decreases apoptosis of proximal tubular epithelial cells treated with high glucose. (A) Serum-starved cells were treated with rapamycin (20 nM) for 24 hours before exposure to high glucose for the time periods indicated. Data represent annexin V binding and PI staining of cells exposed to high glucose concentration (25 mM). Cells were harvested and stained with FITC-conjugated annexin V and PI for 15 minutes. The cells were analyzed by flow cytometer as described in Concise Methods. Histogram represents mean ± SE of three independent experiments. Significant difference from untreated cells is indicated by *P < 0.05 and **P < 0.01. (B) Flow cytometry data represent one of three experiments. (C) Cells were plated on two-chamber slides. Serum-starved cells were treated with normal or high glucose in the presence or absence of rapamycin for various time points as indicated. Apoptotic nuclei were detected using Hoechst 33258 staining and analyzed by fluorescence microscopy at 350-nm excitation and 460-nm emission. (D and E) Immunoblot and histogram show that pretreatment of HK2 cells with rapamycin (20 nM) for 24 hours before exposure to high glucose for 36 hours abolishes phosphorylation of p70S6K, (F and G) decreases Bcl2 phosphoryaltion at Ser 87, (H and I) decreases cytosolic cytochrome c expression, (J and K) decreases cleavage of caspase-3 at 11 kD, and (L and M) decreases the cleavage of PARP at 85 kD. GAPDH was used as loading control. Annexin, Hoechst staining, and Western blot were repeated three times for each time point.
Figure 6.
Figure 6.
Rapamycin inhibits mTOR activation and decreases apoptosis of proximal tubular epithelial cells treated with high glucose. (A) Serum-starved cells were treated with rapamycin (20 nM) for 24 hours before exposure to high glucose for the time periods indicated. Data represent annexin V binding and PI staining of cells exposed to high glucose concentration (25 mM). Cells were harvested and stained with FITC-conjugated annexin V and PI for 15 minutes. The cells were analyzed by flow cytometer as described in Concise Methods. Histogram represents mean ± SE of three independent experiments. Significant difference from untreated cells is indicated by *P < 0.05 and **P < 0.01. (B) Flow cytometry data represent one of three experiments. (C) Cells were plated on two-chamber slides. Serum-starved cells were treated with normal or high glucose in the presence or absence of rapamycin for various time points as indicated. Apoptotic nuclei were detected using Hoechst 33258 staining and analyzed by fluorescence microscopy at 350-nm excitation and 460-nm emission. (D and E) Immunoblot and histogram show that pretreatment of HK2 cells with rapamycin (20 nM) for 24 hours before exposure to high glucose for 36 hours abolishes phosphorylation of p70S6K, (F and G) decreases Bcl2 phosphoryaltion at Ser 87, (H and I) decreases cytosolic cytochrome c expression, (J and K) decreases cleavage of caspase-3 at 11 kD, and (L and M) decreases the cleavage of PARP at 85 kD. GAPDH was used as loading control. Annexin, Hoechst staining, and Western blot were repeated three times for each time point.
Figure 7.
Figure 7.
High glucose results in the redistribution of YY1 from the cytoplasm to nucleus, and rapamycin reverses these effects. Immunostaining and Western blot analysis were used to detect the localization of YY1 in cells exposed to normal glucose or high glucose for 36 hours or cells treated with rapamycin (20 nM) for 24 hours before exposure to high glucose for 36 hours. (A) Alexa Fluro 594 red signals for YY1 were detected using a filter with excitation range of 535 nm and DAPI blue signals for nuclear DNA using a filter with excitation at 488 nm. To show staining specificity, control cells were stained without primary antibody. (B) High glucose decreases YY1 in the cytoplasmic fraction. (C) High glucose increases YY1 in the nuclear fraction. Pretreatment of the cells with rapamycin reversed these changes. Lamin B was used as a nuclear marker. Immunostaining and Western blot were repeated three times.
Figure 8.
Figure 8.
Proposed model of activation of the apoptosis cascade signals in diabetes.

Similar articles

Cited by

References

    1. Verzola D, Bertolotto MB, Villaggio B, Ottonello L, Dallegri F, Berruti V, Gandolfo MT, Frumento G, Garibotto G, Defferrari G: Taurine prevents apoptosis induced by high ambient glucose in human tubule renal cells. J Investig Med 50: 443–451, 2002 - PubMed
    1. Allen AD, Harwood SM, Varagunam M, Raftery MJ, Yaqoob MM: High glucose-induced oxidative stress causes apoptosis in proximal tubular epithelial cells and is mediated by multiple caspases. FASEB J 17: 908–921, 2003 - PubMed
    1. Liu F, Brezniceanu ML, Wei CC, Chénier I, Sachetelli S, Zhang SL, Filep JG, Ingelfinger JR, Chan JS: Overexpression of angiotensinogen increases tubular apoptosis in diabetes. J Am Soc Nephrol 19: 269–280, 2007 - PMC - PubMed
    1. Verzola D, Bertolotto MB, Villaggio B, Ottonello L, Dallegri F, Salvatore F, Berruti V, Gandolfo MT, Garibotto G, Defferrari G: Oxidative stress mediates apoptotic changes induced by hyperglycemia in human tubular kidney cells. J Am Soc Nephrol 15: S85–S87, 2004 - PubMed
    1. Park Sh, Choi HJ, Lee JH, Woo Ch, Kim JH, Han HJ: High glucose inhibits renal proximal tubule cell proliferation and involves PKC, oxidative stress and TGF-β1. Kidney Int 59: 1695–1705, 2001 - PubMed

Publication types

MeSH terms