. 2011 Feb 2;31(5):1676-87.
doi: 10.1523/JNEUROSCI.5404-10.2011.

Wnt signaling regulates neuronal differentiation of cortical intermediate progenitors

Affiliations

Wnt signaling regulates neuronal differentiation of cortical intermediate progenitors

Roeben N Munji et al. J Neurosci. .

Abstract

Cortical intermediate progenitors (IPs) comprise a secondary neuronal progenitor pool that arises from radial glia (RG). IPs are essential for generating the correct number of cortical neurons, but the factors that regulate the expansion and differentiation of IPs in the embryonic cortex are essentially unknown. In this study, we show that the Wnt-β-catenin pathway (canonical Wnt pathway) regulates IP differentiation into neurons. Upregulation of Wnt-β-catenin signaling by overexpression of Wnt3a in the neocortex induced early differentiation of IPs into neurons and the accumulation of these newly born neurons at the subventricular zone/intermediate zone border. Long-term overexpression of Wnt3a led to cortical dysplasia associated with the formation of large neuronal heterotopias. Conversely, downregulation of Wnt-β-catenin signaling with Dkk1 during mid and late stages of neurogenesis inhibited neuronal production. Consistent with previous reports, we show that Wnt-β-catenin signaling also promotes RG self-renewal. Thus, our findings show differential effects of the Wnt-β-catenin pathway on distinct groups of cortical neuronal progenitors: RG self-renewal and IP differentiation. Moreover, our findings suggest that dysregulation of Wnt signaling can lead to developmental defects similar to human cortical malformation disorders.


Figures
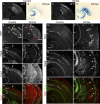
Figure 1.
Figure 1.
Ectopic Wnt3a causes cortical dysplasia and neuronal heterotopias. A–D, The capacity of ectopic Wnt3a to induce Wnt–β-catenin signaling was tested by electroporating E13.5 BAT–gal transgenic embryos with control or Wnt3a expression plasmids. Electroporated embryos were analyzed at E16.5 for GFP expression of electroporation plasmids and β-galactosidase expression of the BAT–gal transgene. A, C, Immunolabeling for GFP. B, D, X-gal staining for β-galactosidase activity. Black solid line in D demarcates the region similar to the electroporated region in C (white solid line). Dashed lines in D demarcate X-gal staining beyond the electroporated region. E–R, Characterization of P2 brains electroporated at E13.5 by immunolabeling for GFP, Ctip2, and Cux1 layer neuron markers and Tbr2 IP marker. E, I, White brackets indicate region of GFP localization in the cortical plate (cp), and red brackets indicate localization of GFP in a heterotopic structure apical to the cortical plate. Yellow arrowheads in E–H indicate the medial boundary of GFP electroporation. F–H, J–L, Immunolabeling for layer VI–V and layer IV–II neurons with Ctip2 (F, H, J, L) and Cux1 (G, H, K, L) antibodies, respectively. M–R, Analysis of IP distribution with Tbr2 immunolabeling. Arrows in M–O indicate IPs in control sample, and white arrowheads in P–R indicate IPs in rosette formation in the experimental sample. Scale bars: A, E, 500 μm; F, M, 200 μm. hc, Hippocampus; ht, heterotopia; nc, neocortex.
Figure 2.
Figure 2.
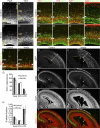
Wnt3a promotes expansion of RG and differentiation of IPs. Brains electroporated at E13.5 were analyzed at E16.5 for the distribution of progenitors and neurons by immunolabeling. A, C, Analysis of RG distribution with Pax6 immunolabeling. Yellow bracket indicates the thickness of the ventricular zone. In B, D–F, and I–P, the boundary between the UTD and DTD subpopulations of Tbr2+ IPs is demarcated by the pairs of yellow or white arrowheads. B, D, Examination of IP distribution with Tbr2 immunolabeling. E–H, Analysis of the numbers and S-phase fraction of IPs. BrdU was injected 1 h before harvest for S-phase fraction analysis. E, F, Representative samples used for quantification of Tbr2+ cells numbers in G and the S-phase fraction of Tbr2+ cell populations in H with Tbr2 and BrdU immunolabeling. I–P, Lineage tracing of progenitors in S-phase with BrdU injected at E15.5, 24 h before harvest and analysis at E16.5. I, M, Coimmunolabeling for BrdU and Tbr2 to determine the localization of IPs born at E15.5. J,K and N,O, Triple immunolabeling for BrdU, Ki67, and Tbr2 to analyze the cell cycle state of BrdU-labeled cells. L, P, Coimmunolabeling for BrdU and Ctip2 to determine the differentiation state of BrdU-labeled cells. Q–X, Triple immunolabeling for GFP, Ctip2, and Cux1 to determine the effect of Wnt3a on neuron production. Q, U, GFP immunolabeling shows the extent of plasmid expression. White dashed lines in U–X indicate the region in which Ctip2 and Cux1 expression are most strongly affected. Q, U, Analysis of neocortex morphology. White double-ended arrows and yellow dashed lines indicate the thickness and trace the length of the neocortex, respectively. Nodules positive for ectopic Ctip2 is indicated with a white asterisk in U–X. Scale bars: A, E, I, 50 μm; Q, 200 μm. Error bars represent SEM. In G, *p < 0.05 and **p < 0.001.
Figure 3.
Figure 3.
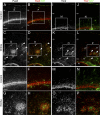
Intermediate progenitors can be targets of Wnt signaling in vivo. Analysis of Wnt–β-catenin activity in IPs. Embryos were electroporated with the TOP–dGFP Wnt–β-catenin signaling reporter at E13.5 and analyzed at E14.5 for dGFP expression to visualize Wnt–β-catenin signaling activity. A, Coelectroporation of pCImRFP and TOP–dGFP plasmids to determine whether dGFP expression is affected by electroporation efficiency. Electroporation efficiency is measured by the fluorescence level of RFP, which is expressed under a ubiquitous promoter. A1, Cells expressing strong RFP and weak dGFP. A2, A cell expressing weak RFP and dGFP. A3, Cells expressing weak RFP and strong dGFP. A4, Cells expressing strong RFP and dGFP. B, Immunolabeling for Tbr2 in brains electroporated with TOP–dGFP alone to determine whether Wnt–β-catenin signaling is active in IPs. Arrowheads indicate cells coexpressing Tbr2 and dGFP. Examples of Tbr2+, dGFP+ cells in the ventricular zone (B1), basal DTD (B2), and UTD (B3). C, Quantification of the numbers of dGFP+, Tbr2+ cells within the VZ, basal DTD, and emerging UTD. Scale bars: A, B, 25 μm; A1, 3.125 μm; B3, 6.25 μm.
Figure 4.
Figure 4.
Wnt3a promotes differentiation of neurons in progenitor domains. Characterization of E18.5 brains electroporated at E13.5 by triple immunolabeling for GFP and neuronal markers Ctip2 and Cux1. A–H, White dashed lines demarcate the boundaries between the cortical plate (cp), heterotopia (ht), neocortex (nc), choroid plexus (p), and hippocampus (hc). White double-headed arrows indicate the thickness of the cortical plate, and yellow double-headed arrows indicate the thickness of the heterotopia. A, E, Immunolabeling for GFP show distribution of GFP in the cortical plate and heterotopia. Immunolabeling for Ctip2 (B, D, F, H) and Cux1 (C, D, G, H) show expression of layer neurons in the cortical plate and heterotopia. Scale bars: A, 200 μm. IV–II, Layer IV-II; V, layer V; VI, layer VI.
Figure 5.
Figure 5.
Wnt3a promotes disorganization of RG and IP distribution. Characterization of E18.5 brains electroporated at E13.5 by immunolabeling for progenitor markers. A–P, Immunolabeling for Pax6, Tbr2, and the active cell cycle marker Ki67 to show the distribution and cell cycle state of progenitors. C, D, K, L, Arrows indicate examples of scattered progenitors, and arrowheads indicate examples of progenitors in rosette formations. Higher-magnification pictures in E–H and M–P correspond to boxed areas in A–D and I–L and illustrate colocalization of Ki67 with Pax6 and Tbr2. cp, Cortical plate; ht, heterotopias; hc, hippocampus. Scale bars: A, 200 μm; E, 100 μm.
Figure 6.
Figure 6.
Dominant activation of Wnt signaling drives ectopic neuronal differentiation. Embryos electroporated at E13.5 with a dominant-active form of LEF1 (LEF1–VP16) were analyzed at E16.5 to test the effect of dominant activation of the Wnt–β-catenin pathway on the distribution and molecular identity of IPs. A, E, Immunolabeling for GFP and Tbr2 IP marker to determine the localization of electroporated cells. B–D, F–H, Higher-magnification images of samples A and E. Arrowheads in F–H indicate the positions of cell cohorts electroporated with LEF1–VP16 expressing GFP but not Tbr2. I–P, Triple immunolabeling for GFP, the active cell cycle marker Ki67, and the neuronal marker Ctip2. Arrows in M–P indicate cell cohorts electroporated with LEF1–VP16 coexpressing GFP and Ctip2 but not Ki67. Inset in P is a higher magnification of the boxed area in P for illustrating the colocalization of GFP and Ctip2. Scale bars: A, 200 μm; B, I, 50 μm; inset in P, 12.5 μm.
Figure 7.
Figure 7.
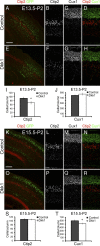
Dkk1 inhibits the production of neurons during mid and late neurogenesis. A–J, Brains electroporated at E13.5 with Dkk1 Wnt–β-catenin pathway inhibitor were analyzed at P2 to test the effect of Dkk1 starting at mid neurogenesis. A, E, Immunolabeling for Ctip2 and GFP shows distribution of electroporated cells. B–D, F–H, Higher magnification of samples A and E immunolabeled with Ctip2 and Cux1. I, Quantification of the numbers of Ctip2+ layer V neurons. J, Quantification of the numbers of Cux1+ layer IV–II neurons. K–T, Brains electroporated at E15.5 with Dkk1 were analyzed at P2 to test the effect of Dkk1 on late neurogenesis. K, O, Immunolabeling for Ctip2 and GFP shows distribution of electroporated cells. L–N, P–R, Higher magnification of samples K and O immunolabeled with Ctip2 and Cux1. S, Quantification of the numbers of Ctip2+ layer V neurons. T, Quantification of the numbers of Cux1+ layer IV–II neurons. Scale bars: A, K, 200 μm; B, L, 50 μm. Error bars represent SEM. *p < 0.05.
Figure 8.
Figure 8.
The Wnt–β-catenin pathway regulates RG self-renewal and IP differentiation. A, Schematic comparing the effect of ectopic Wnt3a to the normal distribution of IPs and newly born IP-derived neurons. The current understanding of IP behavior indicates that IPs differentiate as they migrate from the ventricular zone toward the cortical plate. Our results indicate that excess Wnt3a advances the maturation process of IPs, causing IPs to ectopically differentiate into neurons in the UTD. The resulting neurons fail to migrate to the cortical plate and accumulate in the UTD to form a neuronal heterotopia. B, Our results also show that the Wnt–β-catenin pathway (WβP) plays a dual role in neocortical neurogenesis, promoting RG self-renewal and IP differentiation.

Similar articles

Cited by

References

    1. Backman M, Machon O, Mygland L, van den Bout CJ, Zhong W, Taketo MM, Krauss S. Effects of canonical Wnt signaling on dorso-ventral specification of the mouse telencephalon. Dev Biol. 2005;279:155–168. - PubMed
    1. Chenn A, Walsh CA. Regulation of cerebral cortical size by control of cell cycle exit in neural precursors. Science. 2002;297:365–369. - PubMed
    1. Chenn A, Walsh CA. Increased neuronal production, enlarged forebrains and cytoarchitectural distortions in beta-catenin overexpressing transgenic mice. Cereb Cortex. 2003;13:599–606. - PubMed
    1. Clevers H. Wnt/beta-catenin signaling in development and disease. Cell. 2006;127:469–480. - PubMed
    1. Daneman R, Agalliu D, Zhou L, Kuhnert F, Kuo CJ, Barres BA. Wnt/beta-catenin signaling is required for CNS, but not non-CNS, angiogenesis. Proc Natl Acad Sci U S A. 2009;106:641–646. - PMC - PubMed

Publication types

MeSH terms

LinkOut - more resources