Effect of antibiotic treatment on the intestinal metabolome
- PMID: 21282433
- PMCID: PMC3067180
- DOI: 10.1128/AAC.01664-10
Effect of antibiotic treatment on the intestinal metabolome
Abstract
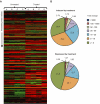
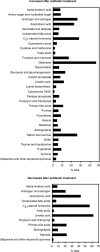
The importance of the mammalian intestinal microbiota to human health has been intensely studied over the past few years. It is now clear that the interactions between human hosts and their associated microbial communities need to be characterized in molecular detail if we are to truly understand human physiology. Additionally, the study of such host-microbe interactions is likely to provide us with new strategies to manipulate these complex systems to maintain or restore homeostasis in order to prevent or cure pathological states. Here, we describe the use of high-throughput metabolomics to shed light on the interactions between the intestinal microbiota and the host. We show that antibiotic treatment disrupts intestinal homeostasis and has a profound impact on the intestinal metabolome, affecting the levels of over 87% of all metabolites detected. Many metabolic pathways that are critical for host physiology were affected, including bile acid, eicosanoid, and steroid hormone synthesis. Dissecting the molecular mechanisms involved in the impact of beneficial microbes on some of these pathways will be instrumental in understanding the interplay between the host and its complex resident microbiota and may aid in the design of new therapeutic strategies that target these interactions.
Figures


Similar articles
-
Metabolomics analysis identifies intestinal microbiota-derived biomarkers of colonization resistance in clindamycin-treated mice.PLoS One. 2014 Jul 2;9(7):e101267. doi: 10.1371/journal.pone.0101267. eCollection 2014. PLoS One. 2014. PMID: 24988418 Free PMC article.
-
Impact of intestinal microbiota on intestinal luminal metabolome.Sci Rep. 2012;2:233. doi: 10.1038/srep00233. Epub 2012 Jan 25. Sci Rep. 2012. PMID: 22724057 Free PMC article.
-
An integrated fecal microbiome and metabolome in the aged mice reveal anti-aging effects from the intestines and biochemical mechanism of FuFang zhenshu TiaoZhi(FTZ).Biomed Pharmacother. 2020 Jan;121:109421. doi: 10.1016/j.biopha.2019.109421. Epub 2019 Nov 25. Biomed Pharmacother. 2020. PMID: 31743877
-
The intestinal metabolome: an intersection between microbiota and host.Gastroenterology. 2014 May;146(6):1470-6. doi: 10.1053/j.gastro.2014.03.001. Epub 2014 Mar 11. Gastroenterology. 2014. PMID: 24631493 Free PMC article. Review.
-
A comparative analysis of the effect of antibiotic treatment and enteric infection on intestinal homeostasis.Gut Microbes. 2011 Mar-Apr;2(2):105-8. doi: 10.4161/gmic.2.2.15610. Epub 2011 Mar 1. Gut Microbes. 2011. PMID: 21637027 Review.
Cited by
-
Bioactive small molecules produced by the human gut microbiome modulate Vibrio cholerae sessile and planktonic lifestyles.Gut Microbes. 2021 Jan-Dec;13(1):1-19. doi: 10.1080/19490976.2021.1918993. Gut Microbes. 2021. PMID: 34006192 Free PMC article.
-
Antibiotic-induced shifts in the mouse gut microbiome and metabolome increase susceptibility to Clostridium difficile infection.Nat Commun. 2014;5:3114. doi: 10.1038/ncomms4114. Nat Commun. 2014. PMID: 24445449 Free PMC article.
-
Escherichia coli isolate for studying colonization of the mouse intestine and its application to two-component signaling knockouts.J Bacteriol. 2014 May;196(9):1723-32. doi: 10.1128/JB.01296-13. Epub 2014 Feb 21. J Bacteriol. 2014. PMID: 24563035 Free PMC article.
-
Impact of deoxycholate on Clostridioides difficile growth, toxin production, and sporulation.Heliyon. 2020 Apr 13;6(4):e03717. doi: 10.1016/j.heliyon.2020.e03717. eCollection 2020 Apr. Heliyon. 2020. PMID: 32322715 Free PMC article.
-
Inferring early-life host and microbiome functions by mass spectrometry-based metaproteomics and metabolomics.Comput Struct Biotechnol J. 2021 Dec 20;20:274-286. doi: 10.1016/j.csbj.2021.12.012. eCollection 2022. Comput Struct Biotechnol J. 2021. PMID: 35024099 Free PMC article. Review.
References
-
- Calder, P. C. 2009. Polyunsaturated fatty acids and inflammatory processes: new twists in an old tale. Biochimie 91:791-795. - PubMed
-
- Frank, D. N., and N. R. Pace. 2008. Gastrointestinal microbiology enters the metagenomics era. Curr. Opin. Gastroenterol. 24:4-10. - PubMed
-
- Funk, C. D. 2001. Prostaglandins and leukotrienes: advances in eicosanoid biology. Science 294:1871-1875. - PubMed
-
- Han, J., L. C. Antunes, B. B. Finlay, and C. H. Borchers. 2010. Metabolomics: towards understanding host-microbe interactions. Future Microbiol. 5:153-161. - PubMed
Publication types
MeSH terms
Substances
Grants and funding
LinkOut - more resources
Full Text Sources
Other Literature Sources
Medical
Molecular Biology Databases
Miscellaneous

